IN TODAY'S ISSUE:
- As the crypto market selloff deepens, we provide an assessment of key market metrics and narratives.
- Structural tailwinds are now becoming headwinds and ETFs, DATs, and stablecoins are all showing signs of reversals.
- Futures data shows traders tried to re-lever up, but their positioning was tenuous as evidenced by the recent round of liquidations.
The Bitcoin Sell-Off Deepens
Bitcoin’s sell-off has accelerated, sliding to $80.5K overnight. The shift in tone has been swift. It has only been six weeks since bitcoin set a new all-time high on October 6th. But shortly after that event, the market absorbed roughly $19B in futures liquidations on October 10th amid renewed China-related tariff concerns. The turmoil triggered pricing dislocations across major exchanges. Although bitcoin staged a partial rebound, the damage had largely been done, and investors have been licking their wounds ever since.
While many commentators framed the pullback as a healthy pause, we struck a more cautious note, highlighting parallels in both timing and narrative structure with prior cyclical downturns. With that context, we are providing an updated assessment of key market metrics.
We have received many questions about the drivers behind the recent price weakness. And although the Trump-China tariff flare-up was certainly an external shock that spooked both traditional and crypto markets alike, the truth is that bitcoin and crypto markets are an ex post exercise rather than ex ante. Investors generate narratives after the fact to explain price movements, rather than prices reacting to well-defined fundamentals, as is more typical in traditional markets.
With that in mind, we believe the $19B in liquidations served as the flashpoint that triggered broader fears of a “cycle end.” The rapid destruction of crypto wealth left traders with limited capacity to re-enter positions, fueling additional price declines. Those declines then reinforced the narrative that the cycle had already run its course, creating a self-perpetuating feedback loop, which is where we find ourselves today.
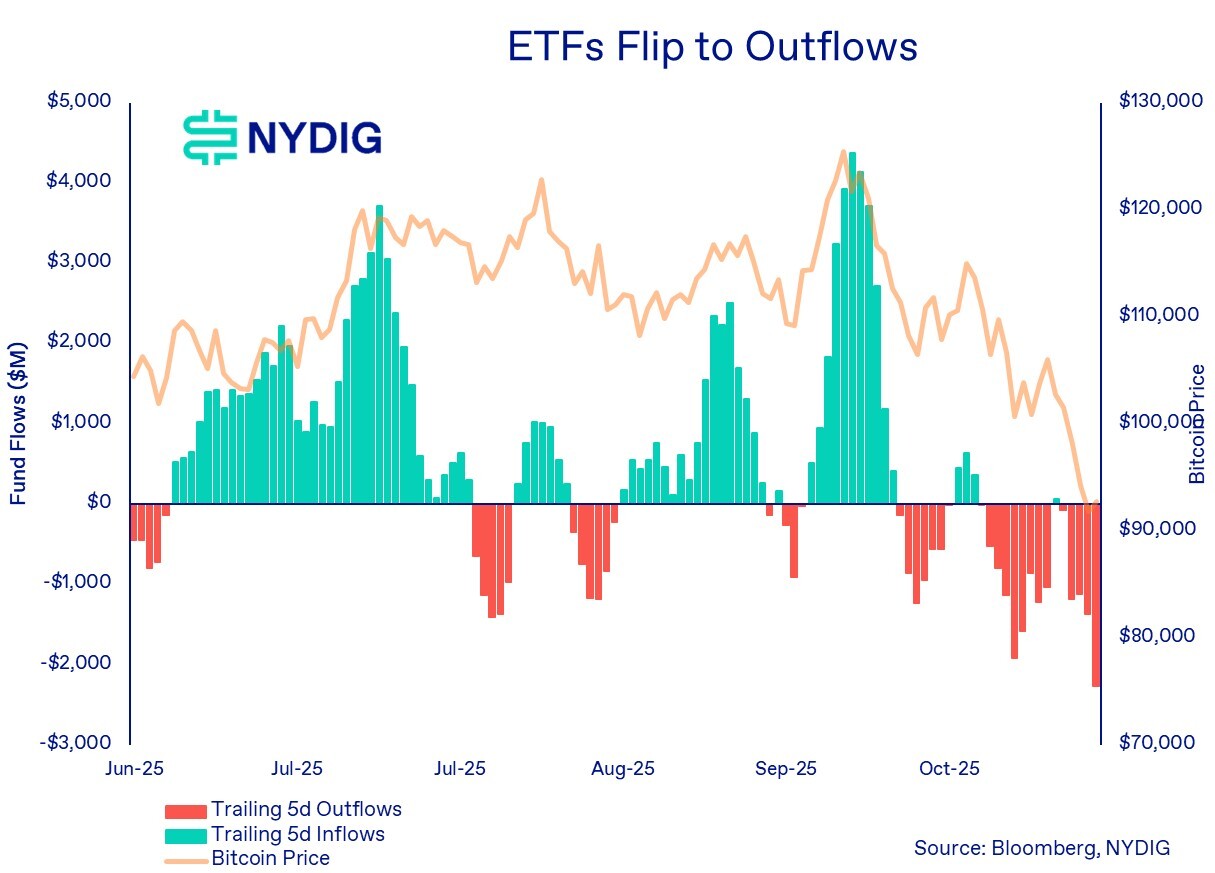
Funds Coming Out of ETFs
Spot bitcoin ETFs in the U.S. have been the standout success story of this cycle, arguably the most successful collective product launch in the history of financial markets. For months, they served as a tailwind, attracting billions in inflows and providing a robust structural bid under the price of bitcoin.
But the following chart now makes clear how quickly that supportive flow regime has reversed. The same ease with which investors funneled capital into these vehicles is now being mirrored on the way out. Over the past several weeks, trailing 5-day flows have flipped decisively negative, with red bars growing larger and more persistent. In other words, what had been a reliable inflow engine has transformed into a meaningful headwind.
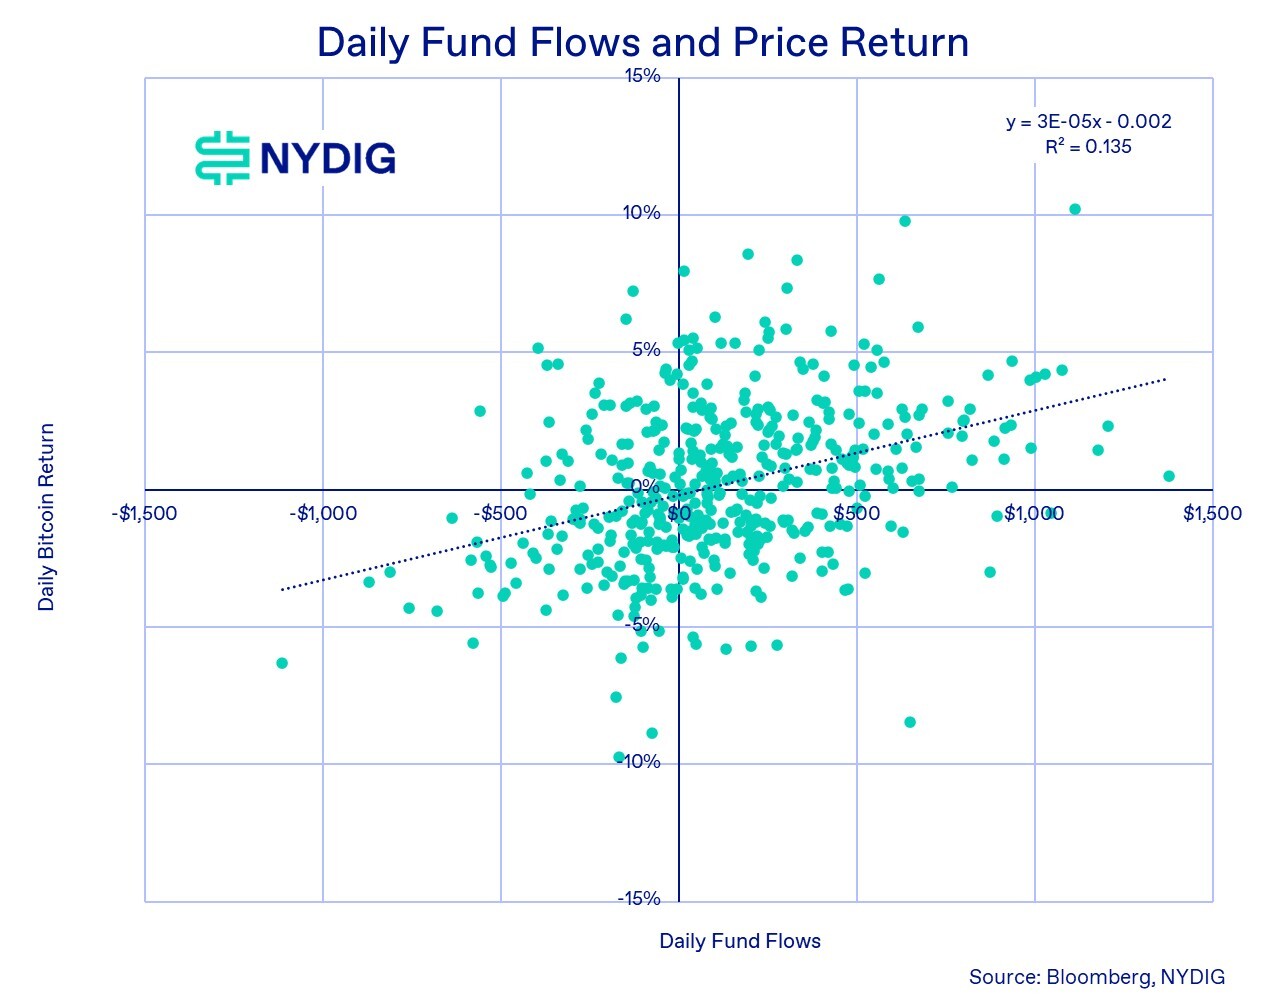
ETF Flows Are Just One Part of the Broader Picture of Price Movements
The relationship between ETF fund flows and daily bitcoin returns, as illustrated in the scatter plot, shows a modest but clear positive correlation. Days with stronger inflows tend to align with positive price performance, while outflow-heavy days skew toward weaker returns. This is reflected in the upward-sloping trend line.
Now that ETF flows have flipped decisively negative, that same relationship implies that ETFs are no longer providing support. They’re exerting downward pressure. The flow regime has effectively crossed from a tailwind to a headwind.
However, the chart also highlights the limits of this relationship. The R-squared of 13.5% indicates that ETF flows explain only a slice of day-to-day price variation. The dispersion of the points, with returns ranging from +10% to -10% even at similar flow levels, reinforces that bitcoin’s price continues to be influenced by a much broader set of factors: derivatives positioning, global liquidity shifts, macro headlines, market structure stress, behavioral dynamics, and idiosyncratic factors.
Still, despite not being the sole driver, ETF flow data has become a meaningful part of the bitcoin price mosaic.
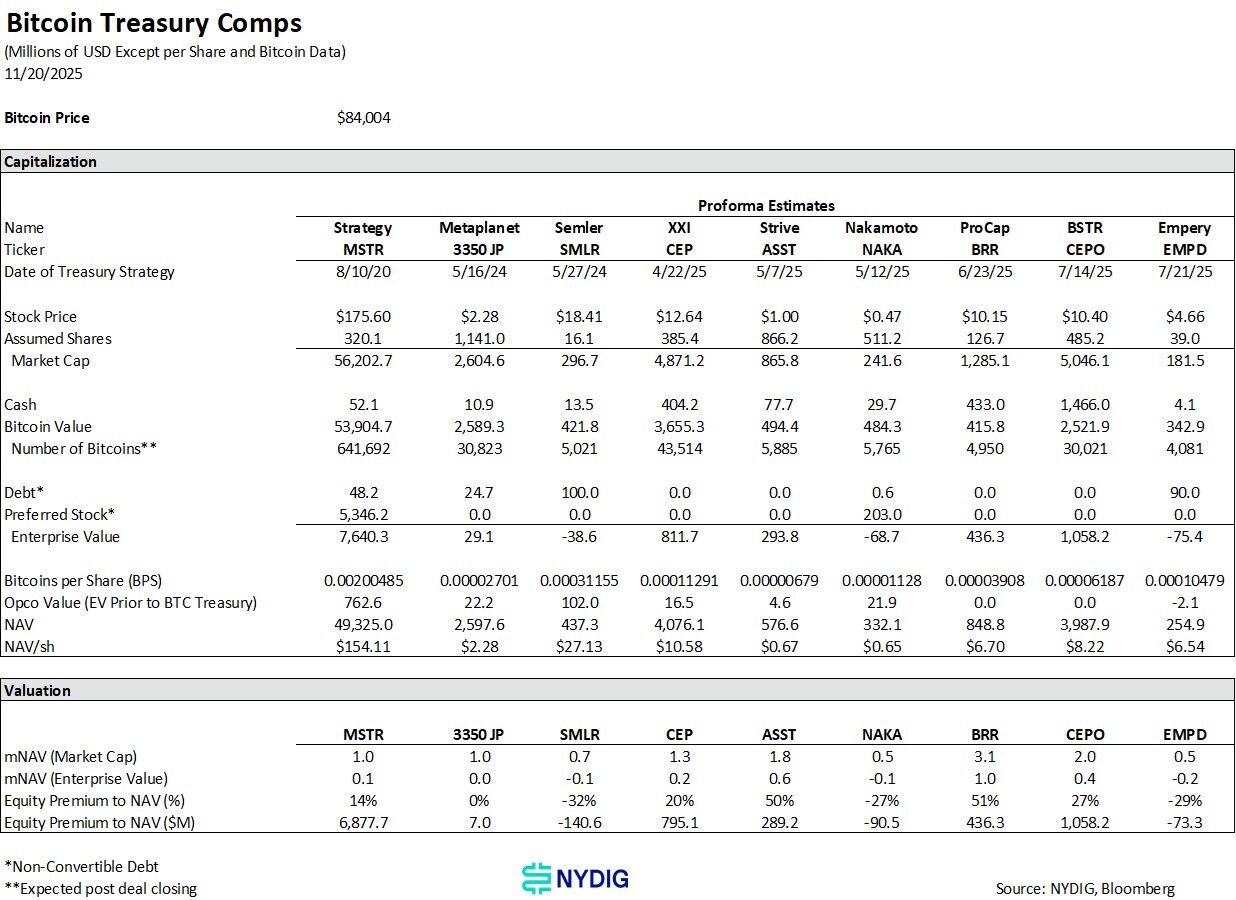
DAT Premiums Compress Threatening a Source of Demand
A major source of structural bitcoin demand, the Digital Asset Treasury (DAT) complex, has meaningfully slowed and is now beginning to show early signs of reversal. For much of the cycle, DATs relied on the premiums at which their shares traded relative to net asset value (NAV). Those premiums were a powerful mechanism that allowed them to steadily accumulate more bitcoin per share by issuing stock and equity-linked instruments and buying crypto (at NAV).
That dynamic has now weakened considerably. Premiums have compressed across the board, and many DATs are trading at outright discounts to NAV. Some of the altcoin-focused DATs have fared far worse, with market prices sitting 60% or more below their underlying asset values.
For DATs facing persistent discounts, the typical response is to lever up, using their crypto holdings as collateral, to repurchase shares and narrow the gap. Others, like Sequans, have instead sold portions of their bitcoin holdings and used the proceeds to buy back stock.
Importantly, while these reversals mark a clear shift from a once-strong demand engine to a potential headwind, no DAT has yet shown signs of financial distress. Leverage remains modest, interest obligations are manageable, and many DAT structures allow issuers to suspend dividend or coupon payments if needed. Even if the market drawdown deepens, the sector still has a long runway before true stress becomes a concern.
Large Purchases Fail to Arrest Slide
We were asked this week what to make of the recent large bitcoin purchases by Strategy and El Salvador. Under normal circumstances, high-profile buys of that size might be expected to provide at least a temporary stabilizing effect. But with bitcoin falling sharply last week, the fact that these sizable purchases didn’t even slow the decline is telling. It underscores that, in the current environment, marginal demand from individual large buyers, no matter how politically or symbolically meaningful, simply isn’t strong enough to counter broader deleveraging and structural outflows.
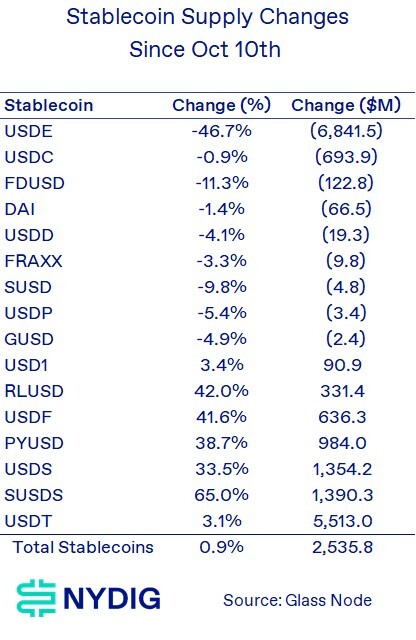
Stablecoins Outflows Imply Investors Are Picking Up Their Bags
Another major pillar of this cycle, stablecoins, are now showing signs of reversal. Stablecoins have long been the foundation of liquidity in both centralized (offshore) exchanges and DeFi, serving as the primary collateral and settlement asset for trading, lending, and derivatives. During risk-off periods, stablecoin balances typically grow as investors rotate out of volatile assets and wait on the sidelines.
But that’s not what we’re seeing now. As the chart shows, total stablecoin supply has dipped for the first time in months. Instead of parking capital in stablecoins, investors appear to be withdrawing liquidity from the ecosystem altogether. That’s a meaningful signal, one that suggests not just de-risking, but actual capital flight.
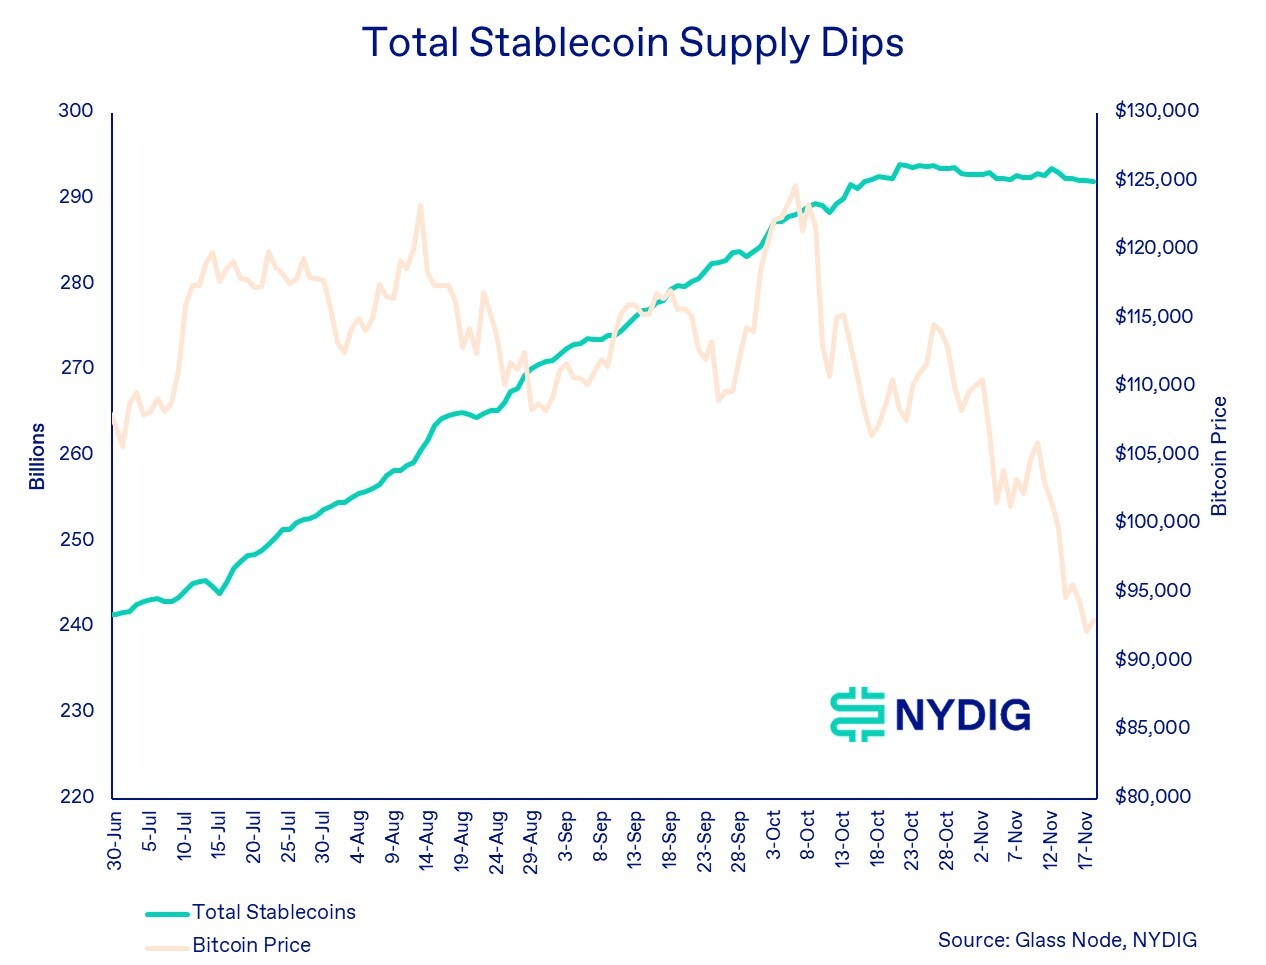
The breakdown of individual stablecoins adds important context. Since the October 10th liquidation event, aggregate supply is up slightly (+0.9%, or $2.5B), but this masks major divergences under the surface. The largest and most concerning move is the collapse of USDE, the algorithmic (sigh) stablecoin issued on the Ethena DeFi platform. USDE has shed an astonishing 47% of its supply, or $6.8B, since the liquidation cascade on October 10th. Given its role in the selloff, where it fell to $0.65 on Binance, its rapid contraction underscores how aggressively capital has been pulled from the system.
Bitcoin Dominance on the Rise
Bitcoin’s increasing dominance during the current correction should come as little surprise. As altcoins have fallen far more sharply than bitcoin, the bellwether asset has naturally grown its share of the industry’s total market capitalization (excluding stablecoins). While stablecoin supply is dipping as well, it is declining at a slower pace than the rest of the market.
The longer-term chart highlights that this is a familiar pattern. Bitcoin dominance tends to surge during cyclical drawdowns, as speculative assets unwind more aggressively and capital consolidates back into the most established, most liquid asset in the ecosystem. We’ve seen this dynamic repeatedly and we’reseeing it again.

Death Crosses – Not as Bad as the Name Implies
Earlier this week, bitcoin triggered a “death cross,” the ominous-sounding technical indicator when the 50-day moving average falls below the 200-day. This is Bitcoin’s 13th such signal and historically, the implication for returns is far less dramatic than the name implies.
The data shows that while death crosses tend to lag golden crosses in subsequent performance, they’ve hardly been bearish on average. Following death crosses, bitcoin’s win rate (percentage of positive returns) is roughly 50% or better, with solid average and median returns.
By contrast, golden crosses produce stronger results, particularly over 180 and 360 days, but the gap isn’t large enough to make death crosses reliable sell signals.
In short, the indicator sounds ominous, but the historical evidence doesn’t justify treating it as a meaningful bearish trigger.

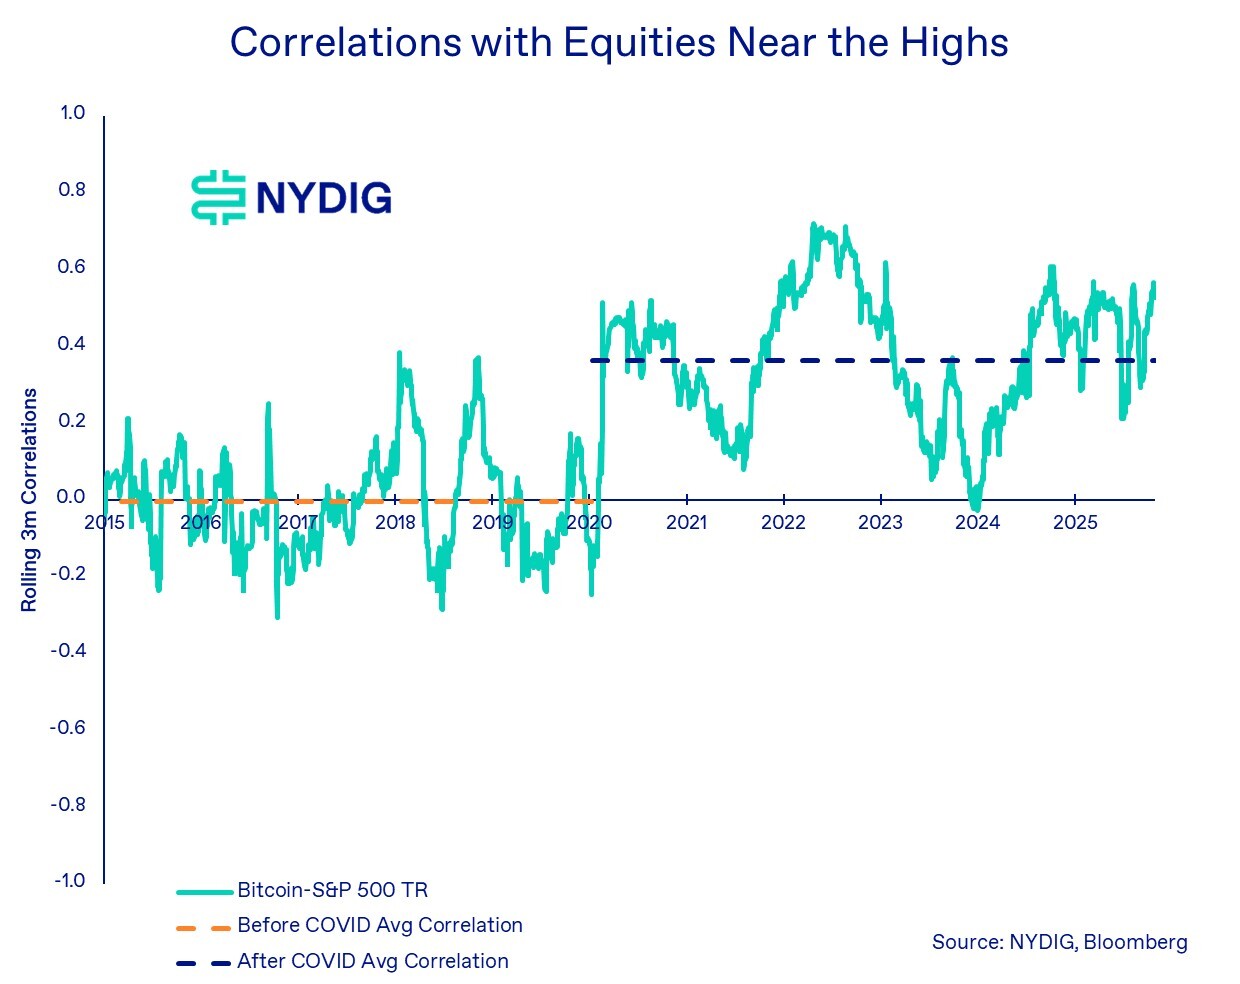
High Correlations but Divergence Indicates Crypto-Specific Issues
Bitcoin’s rolling 90-day correlation with U.S. equities is hovering near its post-COVID highs. As the chart shows, the relationship between bitcoin and the S&P 500 has changed meaningfully over time. Prior to 2020, correlations were close to zero on average and frequently dipped negative, underscoring bitcoin’s reputation as an uncorrelated asset.
That shifted dramatically after COVID. The average correlation in the post-2020 era (indicated by the dashed blue line) is materially higher, with repeated spikes toward 0.5–0.6. Bitcoin has increasingly behaved like a high-beta expression of broader risk sentiment rather than an isolated asset class.
What’s notable today is the divergence: correlations are elevated, yet bitcoin is failing to benefit from strength in the equity markets. This disconnect suggests that crypto-specific pressures, ETF outflows, stablecoin contraction, deleveraging, and fading liquidity are currently overpowering the macro forces that bitcoin would normally track in a high-correlation regime. In short, correlations may be high, but they aren’t helping.
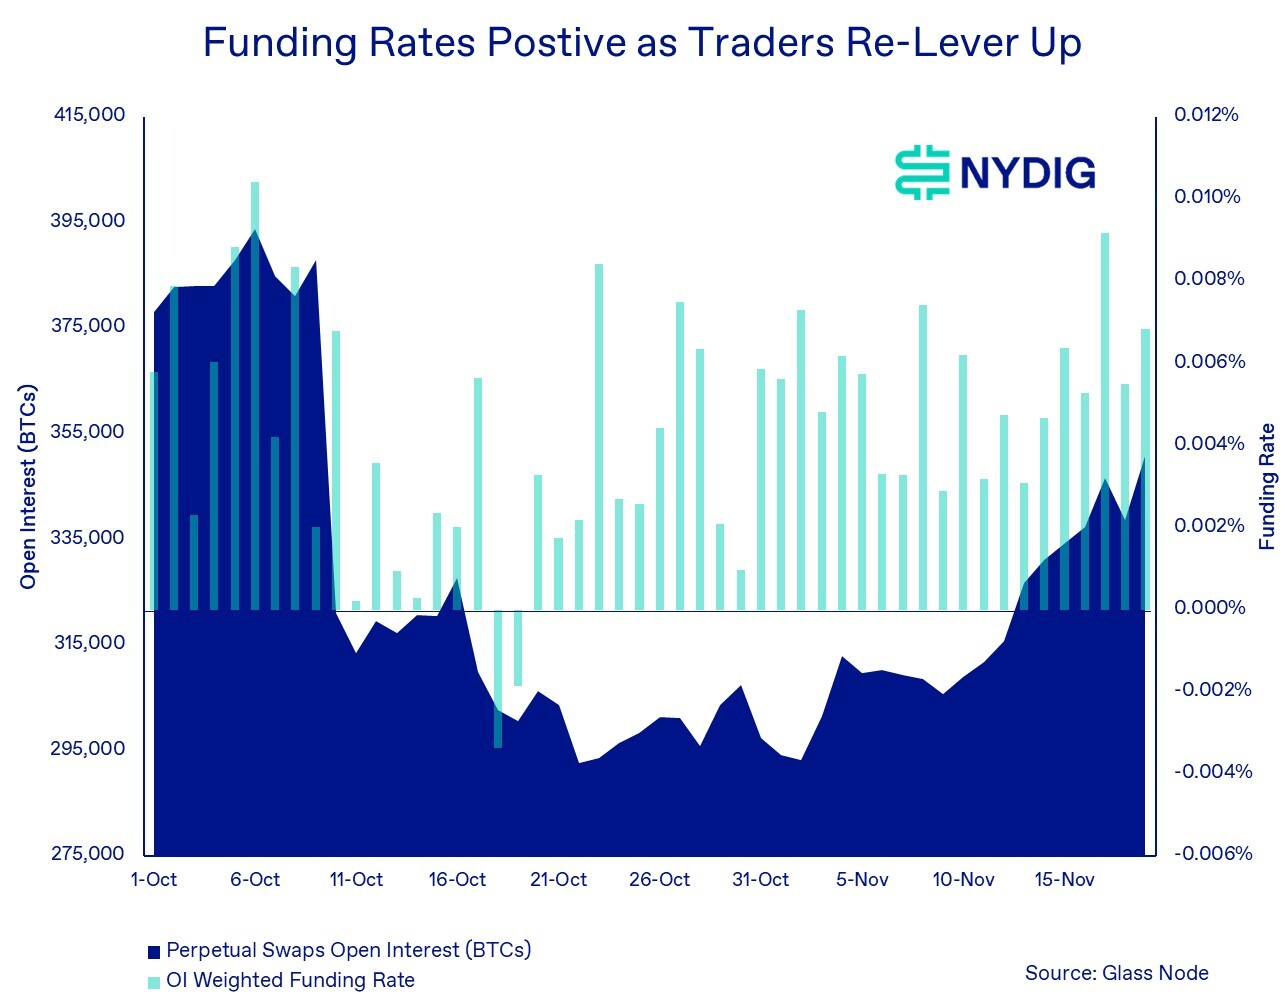
Traders Trying to Re-lever Up Post Liquidation
The October 10th liquidation cascade didn’t just pressure spot prices, it also dramatically reset derivatives positioning. As the chart shows, open interest in perpetual swaps was wiped out in the aftermath of the event, plunging from roughly 380,000 BTC to near 295,000 BTC within days. That kind of abrupt deleveraging is typical during forced liquidations, as positions are closed out mechanically rather than voluntarily.
Since then, traders have been attempting to re-lever. Open interest has steadily climbed back toward pre-liquidation levels, and funding rates have flipped decisively positive, clear evidence that the marginal trader is leaning long again. In a healthy market, rising open interest coupled with positive funding typically signals growing bullish conviction and often supports upward price momentum.
But this time, it isn’t working.
Despite longs returning and leverage rebuilding, bitcoin’s price has continued to fall. The combination of rising funding rates and declining prices suggests that speculative long positioning is being absorbed, if not outright faded, by stronger structural forces. Put differently, traders are pressing bullish bets, but the market is not responding in kind.
This divergence - higher leverage, higher funding, lower prices - often indicates a fragile setup. Unless the underlying demand picture improves, these newly rebuilt long positions could become the next source of liquidation pressure, adding another layer of vulnerability to an already stressed market environment.
Revisiting the Bitcoin Cycle Narratives Framework
Our recent “Bitcoin Cycles Narratives Framework” has been one of the most useful lenses for understanding where we are in the market’s structural arc. Each major cycle follows the same pattern: a new demand narrative ignites, reflexive inflows build, a shock exposes leverage, feedback loops reverse, and the industry rebuilds around a new narrative. What’s striking today is how closely the current environment is tracking that script again.
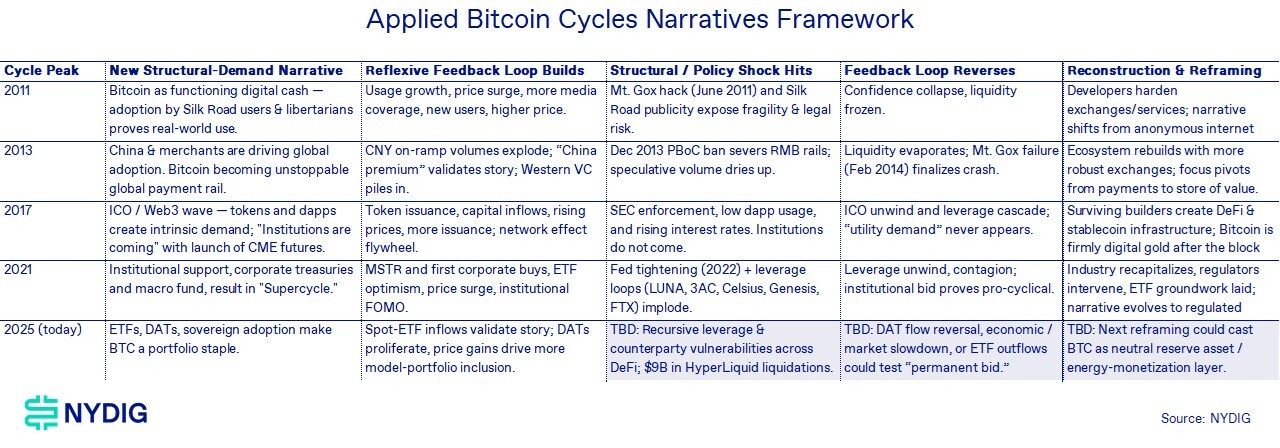
The Reflexive Loop
Every bitcoin cycle is powered by a self-reinforcing loop: new structural demand emerges, capital flows in, narratives strengthen, political and regulatory changes, and rising prices validate the thesis. In this cycle, that loop was driven by ETF inflows, growing DAT demand, and early signs of sovereign accumulation. Together, these forces created a powerful sense that bitcoin was graduating into a mainstream portfolio asset.
But the October 10th liquidation event marked a clear turning point. What looked like a temporary shock instead triggered a broader shift in flows:
- ETF inflows stalled and then reversed
- DAT premiums collapsed, flipping many vehicles into net sellers
- Stablecoin supply slipped, signaling liquidity leaving the system
These aren’t isolated data points, they’re the classic signs of a reflexive loop losing momentum. And historically, once that loop breaks, the market tends to follow a predictable sequence. Liquidity tightens, leverage attempts to re-form but struggles to gain traction, and previously supportive narratives stop translating into actual flows.
We’ve seen this in every major cycle. The story changes, but the mechanics don’t. The reflexive loop pushes the market up, and its reversal sets the stage for the next phase of the cycle.
Hope for the Best, Prepare for the Worst
The secular story for bitcoin remains intact. The asset continues to gain institutional pathways, sovereign interest is slowly building, and its role as a neutral, programmable monetary asset is still very much in play. Nothing in the past few weeks changes that long-horizon trajectory.
But the cycle story, the one driven by flows, leverage, and reflexive behavior, is now asserting itself far more forcefully.
Investors should hope for the best, but prepare for the worst. If past cycles are any guide, the path forward is likely to be uneven, emotionally taxing, and punctuated by sudden dislocations. Issues in DeFi could become more visible. Weak business models in CeFi may come under strain. Capital may continue to leak out through stablecoins. ETF outflows could persist. And anything that can happen in crypto markets often does, usually at the least convenient time.
This is not a call for pessimism. It’s a call for realism. The long-term thesis is still alive, but the near-term environment may be shaped by well-worn cyclical mechanics. History suggests the next stretch could be bumpy, but secular conviction remains an important asset for long-term investors.
Market Update
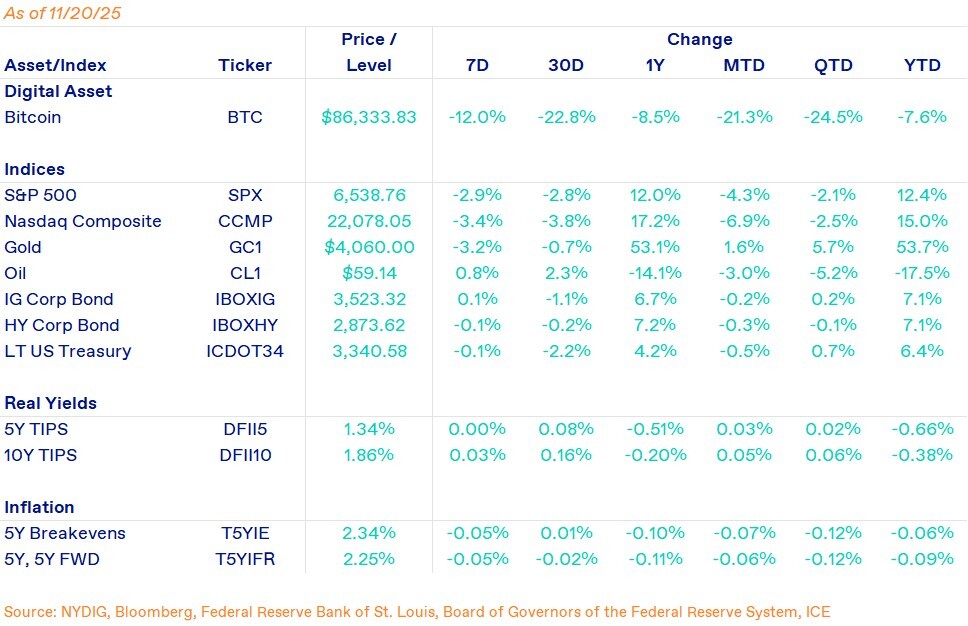
Bitcoin had another difficult week, falling 12.0% through Thursday’s close (even further when considering Friday morning), extending what has become a deeply challenging month for the asset. The protracted drawdown has now pushed performance negative for the year, -7.6%.
Equities also struggled this week, but nowhere near to the same extent. The S&P 500 fell 2.9%, while the Nasdaq Composite dropped 3.4%, both experiencing modest pullbacks as investors assess the impact of NVDA earnings and the AI-driven equities rally.
Commodities were mixed in the week. Gold slid 3.2% on the week but remains one of the standout performers of 2025, up 53.1% year-over-year. Across credit markets, both investment-grade and high-yield corporate bond indices were essentially flat in the week, reflecting stable credit conditions despite the equity pullback.
Indicators of crypto trader positioning remain relatively subdued. CME futures are trading with a modest mid–single-digit annualized basis, and funding rates across perpetual swaps are only mildly positive, both signs of light, cautious positioning rather than aggressive risk-taking. But with $2.1B in crypto futures liquidations hitting the market overnight, the fragile re-leveraging dynamic we flagged earlier in this note appears to be playing out again.
Important News This Week
Investing:
Crypto Liquidations Near $2 Billion as Bitcoin Rout Deepens - The Block
Ray Dalio Owns Bitcoin. He’s Still Nervous About Quantum Computing, Central Bank Adoption - Decrypt
Why Bitcoin Has Value - Bitwise
Jim Chanos Cover MSTR Short - X
Regulation and Taxation:
El Salvador Buys 1,090 BTC as Prices Drop and IMF Pressure Mounts - CoinDesk
Boozman, Booker Release Bipartisan Market Structure Discussion Draft - U.S. Senate
China Accuses U.S. of Stealing 127K BTC in High-Profile Crypto Hack - CoinDesk
Companies:
From Sweet to Sour: Core Slaps Maple with Injunction Over ‘syrupBTC’ - Protos
Ether Treasury Firm FG Nexus Unloads Nearly 11K ETH to Fund Share Buyback - CoinDesk
Tether Makes Strategic Investment in Ledn to Expand Bitcoin-Backed Lending Market - The Block
Upcoming Events
Nov 28 - CME Expiry
Dec 10 - FOMC interest rate decision