IN TODAY'S ISSUE:
- On Wednesday, Treasury expanded long-end buybacks to rein in long-term yields. This resulted in a weaker dollar, while scarce assets like bitcoin and gold rallied. Importantly, 30-year Treasuries have already given back most of their initial post-announcement gains.
- Bitcoin performed exactly the job the allocation exists for, with convexity. A U.S. fiscal-credibility event drove bitcoin up over 20% against gold’s 7%.
- Bitcoin’s breakout was amplified by extreme short liquidations, but demand extended beyond leverage. The initial squeeze cleared crowded shorts, while more than $1.1 billion of net spot ETF inflows across Wednesday and Thursday suggests fresh capital followed the move rather than simply liquidations driving it.
- Roughly two-thirds of the move clustered around the CME benchmark and Deribit expiry windows, pointing to institutional accumulation and derivatives-driven amplification. CME activity was more consistent with benchmark-sensitive buying and Deribit moves looked more like forced short covering.
Bitcoin Wakes Up to Treasury’s Twist
Bitcoin snapped out of a prolonged lull this week, surging from $65,000 on Wednesday to nearly $80,000 on Friday, a gain of over 20%. The immediate catalyst was the Treasury’s decision to increase buybacks of longer-dated bonds. While these actions do not directly affect bitcoin’s price, their second-order implications for inflation, the U.S. dollar, and real interest rates do. We examine what the policy shift means for bitcoin, how positioning ahead of the announcement amplified the rally, and what might come next.
Washington Moves to Contain Long-Term Rates
On Wednesday, Treasury announced that, beginning September 9, it would at least double the maximum size of liquidity-support buybacks in the 10-to-20-year and 20-to-30-year nominal coupon sectors, from $2 billion to $4 billion per operation. The larger operations will remain in place through November 4, the end of the current refunding quarter. The move followed a sharp rise in long-term rates, with the 30-year Treasury yield reaching approximately 5.33% on August 18, its highest level since 2007.
Treasury’s official explanation was that the larger operations would provide greater liquidity support in long-dated securities. Still, the timing of the announcement, together with Secretary Bessent’s subsequent comments about using the government’s toolkit to bring down yields, points to clear concern about elevated long-term borrowing costs.
This Flattens the Curve, but It Does Not Print Money
The mechanics of the move are straightforward, as are its implications for the yield curve. Treasury will buy back older, less-liquid, long-dated securities while continuing to meet its financing needs through new issuance. Under the current financing plan, much of the marginal funding adjustment is expected to be absorbed through Treasury bills. To the extent that 3030occurs, the combination tilts marketable debt supply toward shorter maturities at the margin, reducing the duration the private market must absorb. Unlike Operation Twist, however, this is not a one-for-one swap of short-dated securities for long-dated ones.
All else equal, that mix should flatten the yield curve by supporting long-bond prices while adding supply at the short end. The operation does not expand the Federal Reserve’s balance sheet or reduce the government’s net borrowing requirement. Treasury must finance the buybacks with cash and ongoing debt issuance. It is a debt-management exercise, not monetary financing. Contrary to some claims on social media, this is not money printing.
This Looks More Like Operation Twist Than QE or Yield-Curve Control
While some on social media have called this quantitative easing (QE) or yield-curve control (YCC), the market effect is much closer to Operation Twist than either. As a refresher, under the Federal Reserve’s 2011 Maturity Extension Program (MEP, or “Operation Twist”), the Fed bought $400 billion of six-to-30-year Treasuries and sold an equal amount of securities with three years or less remaining. It later extended the total to $667 billion. The balance sheet did not grow; its maturity changed.
The distinction matters because Treasury’s actions do not expand the Federal Reserve’s asset holdings. QE, by contrast, expands the central bank’s balance sheet and creates reserve balances. YCC goes further by committing the central bank to defend a specified yield, potentially through unlimited purchases. Treasury has announced neither a yield target nor an open-ended commitment. It has announced scheduled operations with stated purchase limits through November 4, just after the midterm elections, when the current schedule ends. The fact that this is being conducted by Treasury, the borrower, rather than the Fed, the central bank, is notable and different from Operation Twist.
In 2011, the Announcement Did the Work
Operation Twist in 2011 provides the closest precedent for the measures announced this week. By separating market moves around the announcement from those recorded during implementation, we can distinguish the effect of the policy signal from that of the purchases themselves. The evidence suggests that the announcement did most of the work. The 30-year Treasury yield fell from 3.20% on September 20 to 2.78% on September 22, a 42-basis-point decline around the announcement. Fifteen months and $667 billion of maturity-extension purchases later, the yield stood at 2.83%, five basis points above its immediate post-announcement level.
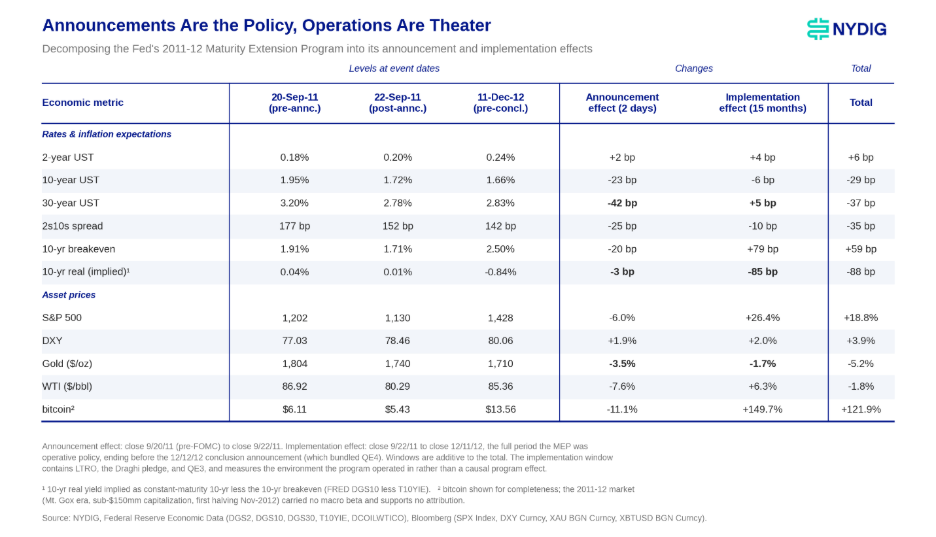
The lesson is not that Operation Twist was irrelevant. The announcement triggered a substantial response in rates, and equities subsequently recovered. Rather, duration management did not produce the conventional debasement trade. Gold declined and the dollar strengthened both around the announcement and over the broader implementation period.
The later equity rally also cannot be attributed cleanly to Operation Twist. The same period included the European sovereign debt crisis, the ECB’s long-term refinancing operations, and, eventually, QE3. Markets rarely provide controlled experiments, perhaps because economists would enjoy them too much.
Wednesday’s Tape Rejected the Bond Rally but Kept the Hard-Asset Rally
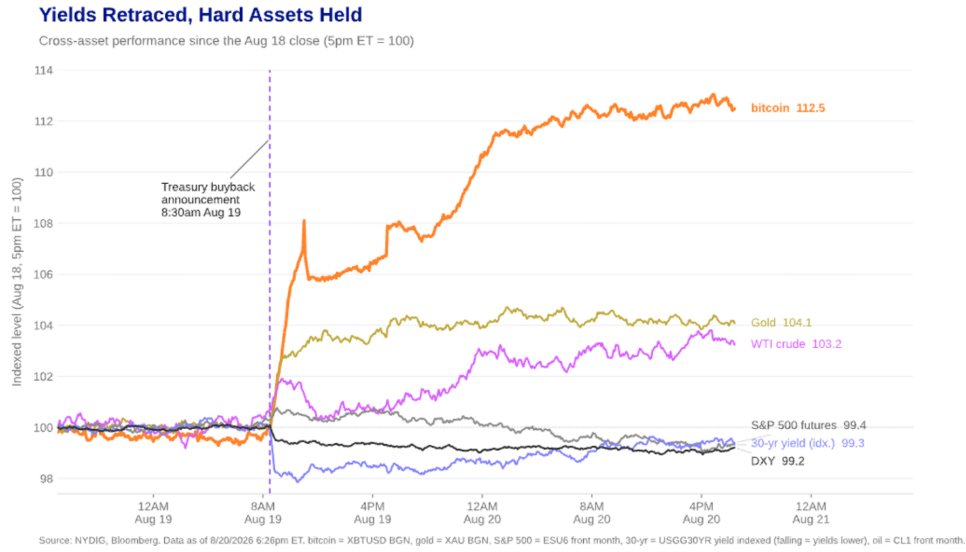
Wednesday’s cross-asset response was almost the inverse of 2011. DXY fell approximately 0.8% to 98.8 and retained most of that decline on Thursday. Bitcoin rose from around $65K to nearly $70K on Wednesday and then kept going. Gold gained roughly 4% to more than $4,500 per ounce.
The 30-year yield initially fell nine basis points to 5.194%, then rebounded giving back almost all of the initial move. The S&P 500 gained 0.2% on Wednesday but traded lower on Thursday, ending below where it started.
The Dollar Became the Release Valve
If long rates cannot remain lower even after Treasury advertises incremental demand, but the market still wants easier financial conditions, the adjustment has to occur elsewhere. The dollar is the obvious release valve. And a weaker dollar raises the dollar price of scarce and globally traded assets, including gold and bitcoin, without requiring the long bond to sustain its rally.
We would not make strong pronouncements, however, from such a short window. Position unwinds can cause interesting price action. However, the fact that rates and equities surrendered much of their initial response while the dollar remained weaker and gold and bitcoin remained higher suggests that investors were reacting less to the purchases themselves than to what they revealed about Washington’s willingness to counter elevated long-term rates.
Bitcoin Entered the Catalyst Like a Coiled Spring
Bitcoin was especially primed for such a catalyst because it had spent nearly 3 months trading sideways, all while absorbing several pieces of bad news without breaking to the downside. Strategy turned from buyer of last resort to a seller. The Senate left for recess without voting on the CLARITY Act, despite taking the first procedural step toward a September vote. The Coldcard entropy flaw left personal hardware wallets vulnerable and resulted in at least 1,778 BTC of confirmed losses.
Yet bitcoin continued to hold around the low-to-mid-$60,000s. When an asset stops falling on bad news, the marginal seller is often largely exhausted. That does not mean no sellers remain. It means the next buyer no longer needs to climb over a queue of them.
Record Short Liquidations Lit the Fuse
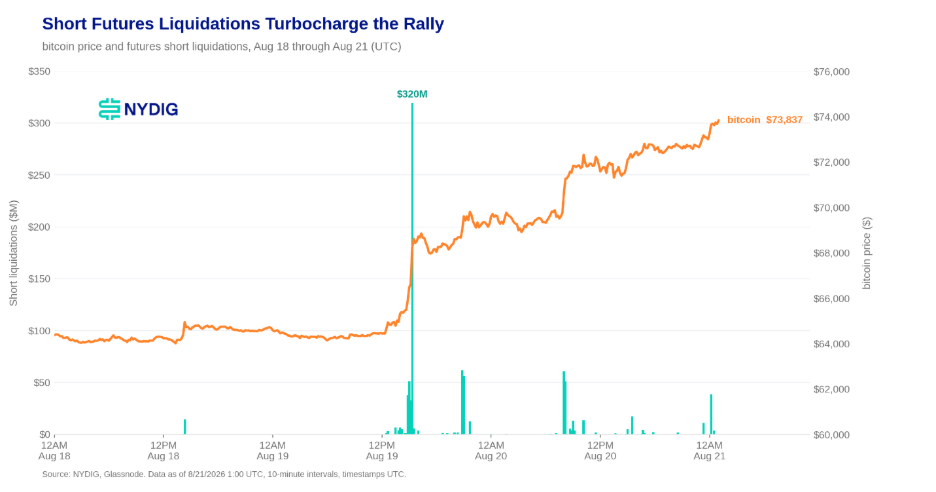
The first leg of the breakout was mechanical. More than $1 billion of bitcoin short positions were liquidated in roughly an hour after the announcement and short liquidations across the crypto market reached approximately $2.7 billion for the day, the largest single-day total in CoinGlass records going back to 2021. Adding Thursday brings the two-day tally to roughly $3.1 billion. Shorts supplied the kindling, but crowded positioning transformed the Treasury announcement into a much larger price move.
Stablecoin Liquidity Is USDC-Led, Not Yet Global
Stablecoin data show liquidity improving, but not yet across the full global investor base. Total stablecoin supply rose $1.25 billion during the rally, from $305.5 billion to $306.75 billion. Nearly all the supply increase came from USDC, while USDT supply is only up marginally.
The largest increases in USDC supply have occurred on Solana and Hyperliquid, where balances rose nearly 5% and 4%, respectively, in a single day. That concentration supports the view that incremental liquidity is flowing into trading venues rather than broadly across the crypto ecosystem. Solana is most well-known for memecoin trading, while Hyperliquid is known for leveraged trading. USDT supply, however, is up only slightly, providing less evidence that the rally has recruited the broader offshore cohort that typically relies on Tether to trade on centralized exchanges. Existing USDT can be redeployed without new issuance, and stablecoin preference is an imperfect proxy for geography, so the divergence argues against broad overseas participation but does not establish its absence.
ETF Flows Confirm Demand Beyond Leverage
U.S. spot bitcoin ETFs took in a net $517.2 million on Wednesday and then another $606.2 million on Thursday, their largest session of August, bringing month-to-date inflows to approximately $2.1 billion across 14 trading days. Ten of those sessions were positive.
ETF creations cannot tell us why an investor bought, and one strong day can reverse quickly, but they show that demand extended beyond leveraged perpetual-futures traders. The squeeze appears to have opened the door, while strong ETF inflows show that demand broadened beyond leverage.
The Tape Points to Benchmark-Linked Buying, Amplified by Shorts
Two derivatives windows accounted for most of the full-window move shown above. The 4:00 a.m. ET hour around the Deribit expiry contributed 37.5% of the move, while the 11:00 a.m. ET hour around the CME reference-rate window and its immediate aftermath contributed another 28.6%. Together, those two hours explain roughly two-thirds of the return measured in the exhibit.
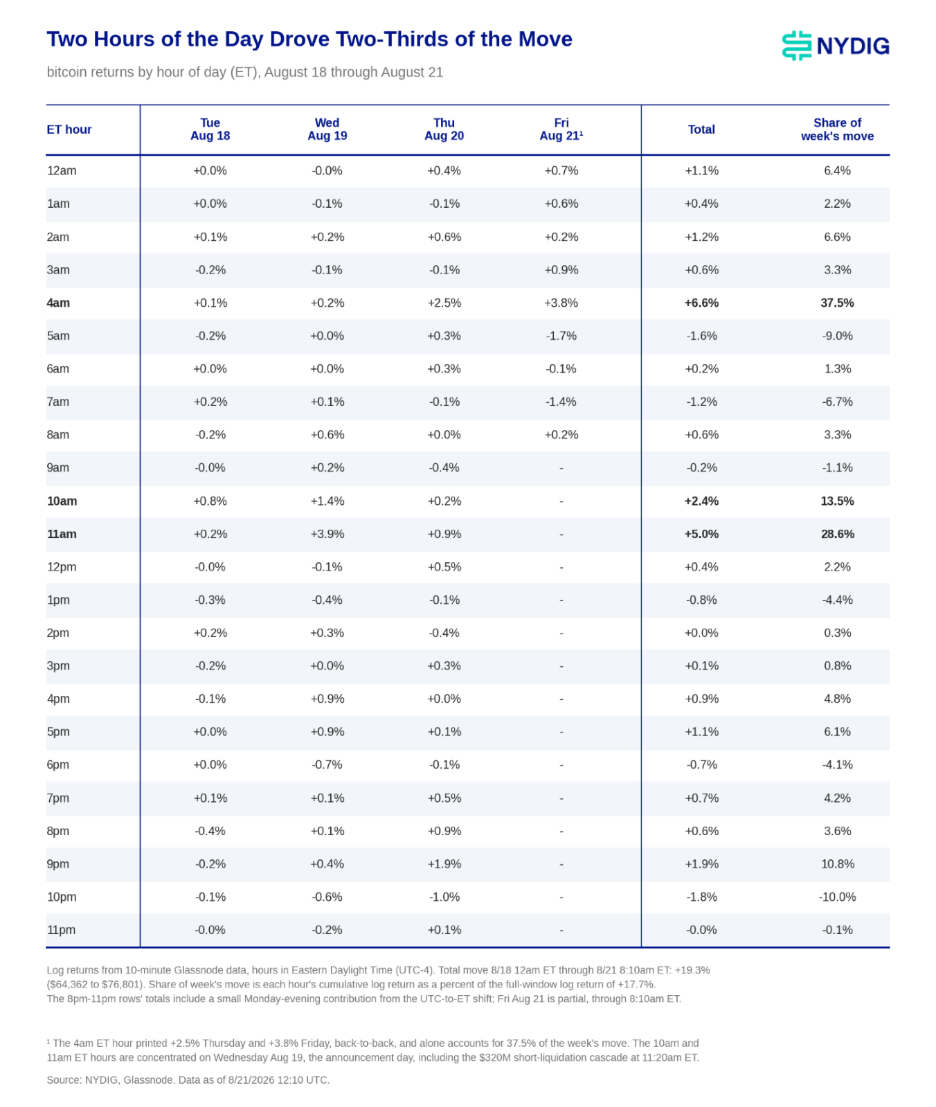
For active investors, the tape is consistent with benchmark-linked buying helping initiate the move while derivatives positioning amplified it. Around the CME reference-rate window, bitcoin was already rising into the fix on Wednesday and Thursday before accelerating afterward. Wednesday’s $315 million short-liquidation cascade followed roughly 20 minutes later, consistent with underlying demand pushing price through liquidation thresholds.
The 4:00 a.m. ET moves show a different signature. Bitcoin was comparatively quiet into the Deribit expiry before surging at or after the 08:00 UTC print on Thursday and Friday, accompanied by large short liquidations. Wednesday’s pre-announcement expiry, by contrast, produced almost no reaction. That points to expiry as a release mechanism for existing positioning, not an independent source of demand.
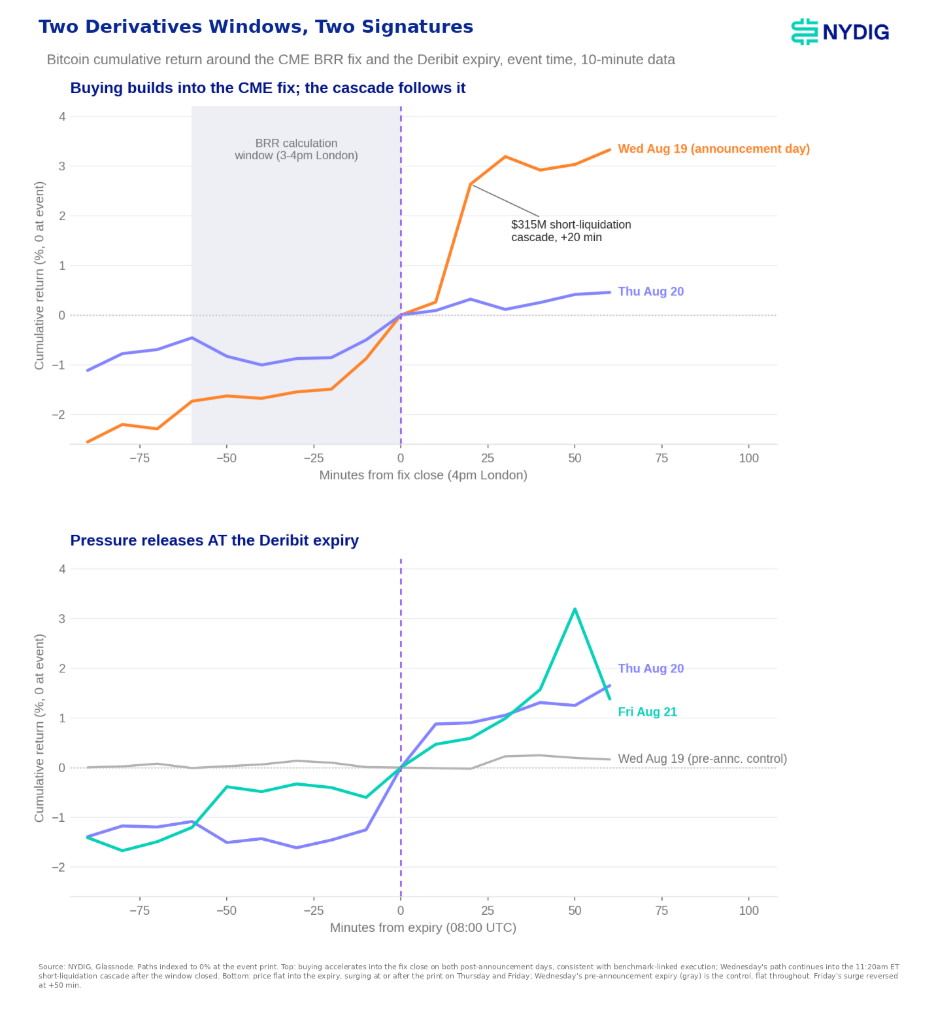
For institutional investors, the distinction matters: the CME-window activity is more consistent with persistent, benchmark-sensitive allocation, while the Deribit moves look like forced buying layered on top. If the rally is durable, continued benchmark-linked demand around the CME window matters more than another liquidation-driven burst at 4:00 a.m.
Bitcoin’s Long Slumber May Be Over
This may be what it took to wake bitcoin up. The Treasury announcement landed on exhausted marginal selling, dense short positioning, available stablecoin liquidity, and improving ETF demand. The result was not simply a higher price, but a change in the question investors are asking.
For much of the past several months, sidelined investors could afford to wait. Bitcoin was going nowhere, catalysts repeatedly disappointed, and there was little penalty for patience. A breakout changes that calculus. Investors who were waiting for a cleaner entry now have to consider the risk that the entry has already begun to move away from them. Even if bitcoin retraces some of this week’s gains, the conversation is increasingly about how to build exposure on weakness, not how to get out.
That shift in psychology may prove more important than the short squeeze that started the move. ETF inflows, broader stablecoin growth, and continued benchmark-sensitive buying would strengthen the case that institutional demand is re-engaging. A near-term pullback would not invalidate that thesis. After months of investors watching from the sidelines, it may simply give them the opportunity they have been waiting for.