IN TODAY'S ISSUE:
- We dig into bitcoin’s past price cycles to understand whether its booms and busts may be changing.
- We map out a narrative framework and overlay the current cycle to see what suggests about where we might be now.
- We outline possible future scenarios using the framework, to see whether cycles continue to repeat or give way to a new era defined by "The Forever Bid.”
The Bitcoin Cycle: From Reflexive Narratives to The Forever Bid
Without question, the most important issue at this point in the market cycle is whether bitcoin’s historical patterns are intact, and if so, whether bitcoin has already peaked. A widespread narrative has emerged suggesting that the evolving structure of crypto investing, shaped by improved regulation, political support, sovereign ownership, and growing institutional and corporate adoption, has fundamentally changed bitcoin’s nature. According to this view, bitcoin has shifted from a cyclical asset to a secular one: The Forever Bid. Many pundits have now quite literally declared, “bitcoin’s four-year cycles are dead.”
The Alternative Hypothesis: This Time is Different
While that may one day prove true, such a claim rests on the assumption that this time is different. Bitcoin’s repeating four-year boom-and-bust cycles remain one of the great puzzles of financial theory. They represent a direct challenge to even the weakest form of the Efficient Market Hypothesis, the idea that past prices cannot predict future prices, a foundational tenet of economics. (We have written on this subject ad nauseam and will continue to do so again in this piece.) Yet, these cycles continue to recur with striking regularity in both form and duration, albeit with diminishing intensity. As such, they constitute the null hypothesis, the presumption of continuity. Therefore, the burden of proof lies with those asserting something extraordinary: a genuine break from historical precedent.
Allocate, Don’t Speculate
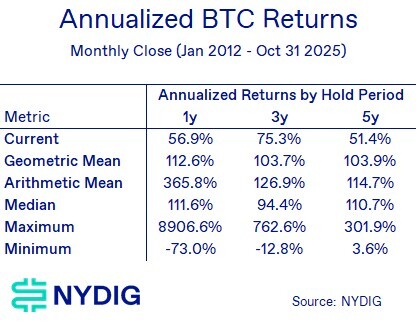
We’ve long advocated for a “set it and forget it” approach to investing in bitcoin. Make a thoughtful allocation (whether 0.5%, 1%, 5%, or whatever fits your strategy) and allow it to compound over time. We still stand firmly by the principle, which is best encapsulated with the adage “time in the market beats timing the market.” The key, in our view, is simply getting off zero, the default allocation for most institutions.
The data backs this up. Historically, the worst annualized return for bitcoin investors over any 5-year holding period has been (positive) 3.6%, meaning no one has ever lost money over that timeframe. As the table below shows, extending your investment horizon from one year to five years can steadily convert volatile short-term returns into performance that, at worst, resembles the stability of U.S. Treasuries.
Re-Underwriting Bitcoin Cycles
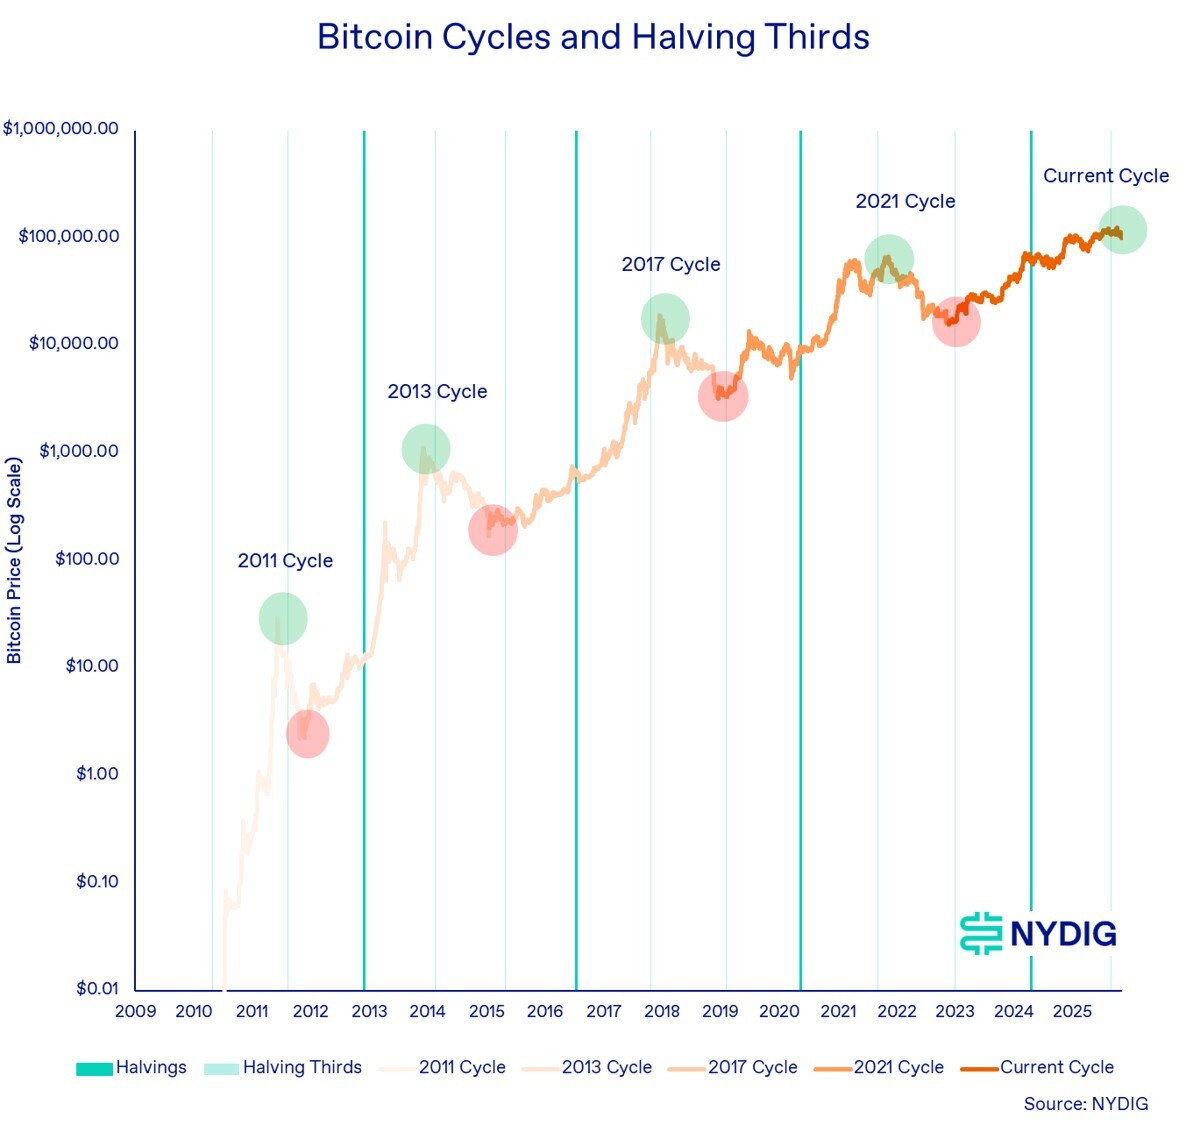
It has come to our attention that some investors may not fully understand bitcoin’s recurring price cycles. While many recognize its pattern of booms and busts, fewer realize just how consistent these cycles have been. In simple terms, roughly every four years, bisected by Bitcoin’s reward halvings, the price moves from a previous cycle low to a new all-time high, typically rising by multiples rather than mere percentages. This surge is then followed by a sharp correction of more than 75%, establishing a new cycle low that serves as the foundation for the next upward phase. The cycles are named for the time their peak price occurred. The following chart illustrates this repeating pattern visually.

The Rule of Thirds
A lesser-known fact is that bitcoin’s cycle peaks and troughs have tended to occur roughly one-third and two-thirds of the way through each halving cycle. While most people frame these moves in terms of calendar seasonality, typically noting that peaks and troughs often happen in Q4, we find this timing pattern within the halving window to be equally insightful. One important caveat: the 2011 cycle stands out as an exception, largely because bitcoin had little to no market price during its first year of existence, and reliable pricing data didn’t emerge until 2010, when Mt. Gox became the dominant trading platform.
What the Numbers Say About the Upswing
When mapping bitcoin’s cycles from trough to peak, the phase we’re currently attempting to identify, the following table outlines both the duration and the corresponding returns. For this analysis and the preceding charts, we have assumed that $126,296 on November 6, 2025, represents a “cycle peak,” even though determining whether that’s true is precisely the question at hand.
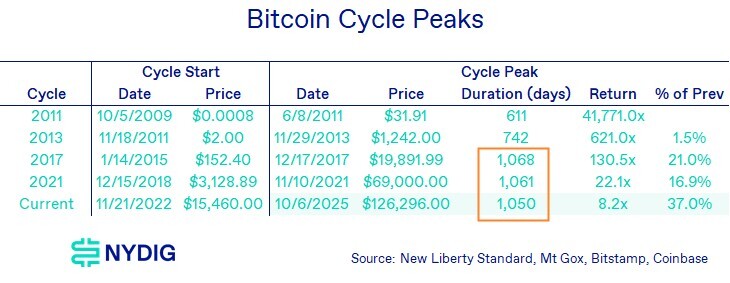
A few key observations emerge. First, the magnitude of trough-to-peak returns has declined with each successive cycle. This is economically intuitive as each new cycle begins from a higher base, and bitcoin simply cannot grow at the same exponential rate when it’s a $2+ trillion asset compared to when it was worth only millions (or less).
Second, the duration of these cycles has been strikingly consistent, particularly over the last three (again, assuming we’ve reached a peak). This consistency persists despite substantial changes in the investor base, macroeconomic conditions, political dynamics, and regulatory landscapes.
Time, Not Price, Should Be the Focus
This leads to an important point. Investors, and readers in general, tend to be most captivated by discussions about bitcoin’s price: where it’s heading, whether it will rise or fall, and what specific targets might be next. Articles and research pieces focused on price forecasts consistently draw the most attention, reflecting the market’s investment-oriented mindset.
However, we place surprisingly little emphasis on setting hard price targets and have rarely done so. Attempting to “price” a highly volatile asset without a clear intrinsic valuation framework (since bitcoin generates no cash flow or earnings) is inherently difficult. For an asset such as bitcoin in long-term secular growth, such efforts often create a false sense of precision. While we still make our best estimates, we acknowledge that they come with wide margins of error.
Instead, our focus lies elsewhere. For short-term price dynamics and cycle analysis, we pay closer attention to market structure, price action, and trader positioning. For the bigger picture, however, we think in terms of time, not price. Historically, time has been a far more consistent indicator of bitcoin’s market cycles than any price forecast. This is why the observed consistency in trough-to-peak durations is so notable. While it’s true that bull markets don’t die of old age, bitcoin’s rhythmic periodicity remains a fascinating and distinctive feature of its market behavior.
Establishing a Cycle Narrative Framework
We have had a front-row seat to nearly all of bitcoin’s market cycles (my own entry point was during the 2011 crash, thanks to NPR’s Planet Money podcast). Over time, a clear pattern has emerged, not just in price movements, but in the interplay between price and narrative. This relationship has become so consistent that we’ve started to formalize it into a framework. It’s still a work in progress, so we welcome any feedback.
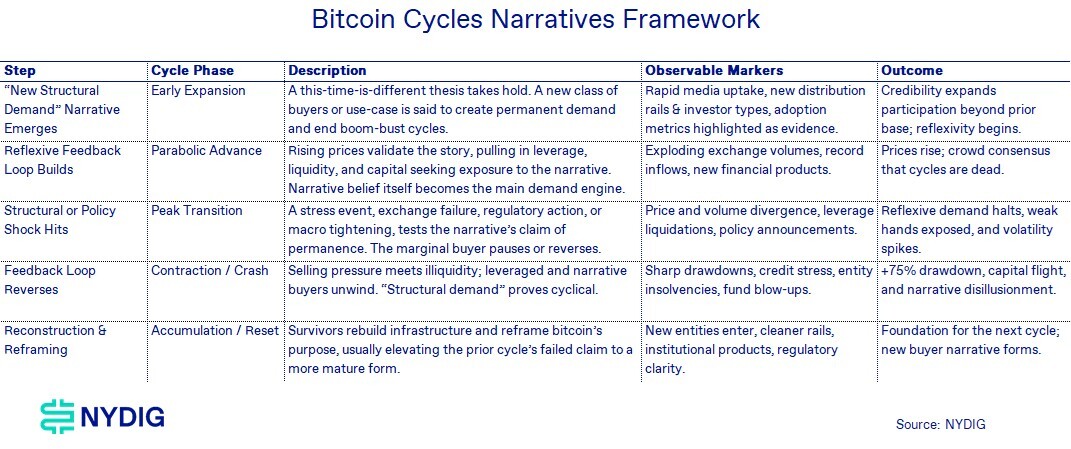
The Bitcoin Cycles Narratives Framework was developed to explain how recurring market narratives drive bitcoin’s boom-and-bust cycles. It organizes each cycle into distinct psychological and structural phases, showing how narratives evolve from optimism to disillusionment and renewal. The framework begins with the emergence of a new “structural demand” story, often tied to innovation or a new class of investors, which fuels early expansion. As confidence grows, a reflexive feedback loop forms: rising prices attract more capital and leverage, reinforcing the belief that “this time is different.” Eventually, a stress event, such as regulatory action, exchange failure, or liquidity shock, tests that belief, triggering the peak transition and ultimately a crash as leverage unwinds. The cycle concludes with reconstruction, when survivors rebuild infrastructure and reframe bitcoin’s purpose, laying the foundation for the next narrative. By connecting observable market markers with behavioral dynamics, the framework helps identify where bitcoin and broader crypto markets might sit within each recurring cycle.
Overlaying Framework with History
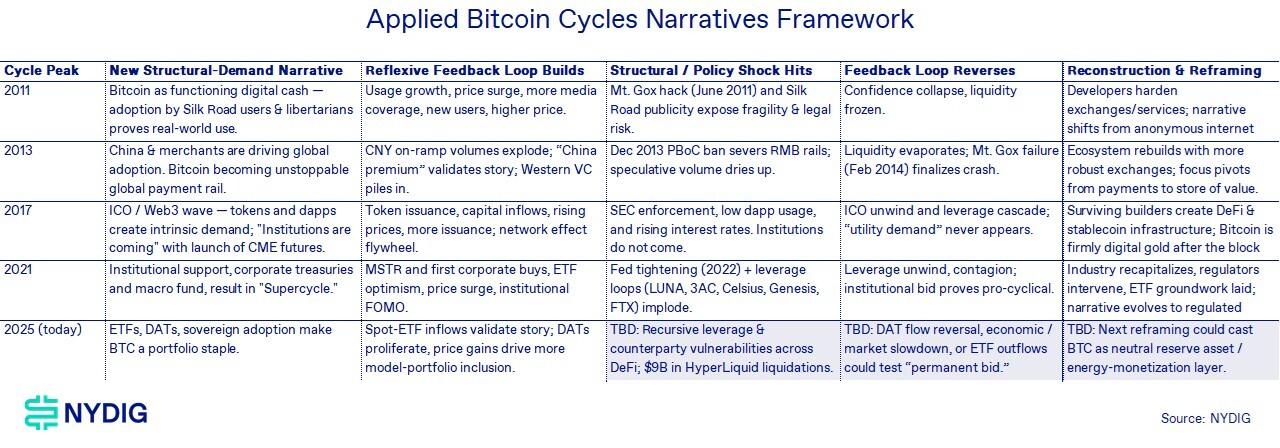
The Applied Bitcoin Cycles Narratives Framework table below takes the conceptual cycle model and maps it onto bitcoin’s historical market peaks, illustrating how each cycle’s dominant narrative, leverage dynamics, and eventual breakdown have repeated over time. From Bitcoin’s early “digital cash” phase in 2011 to the institutional “supercycle” narrative of 2021 from none other than Three Arrows Capital Su Zhu, each wave has followed a familiar rhythm: a new story drives adoption and capital inflows, reflexive feedback loops amplify prices, structural shocks test conviction, and eventual crashes reset the ecosystem. Each reconstruction phase then lays the groundwork for a more mature and institutionalized form of bitcoin participation.
The grayed-out 2025 section represents speculative, forward-looking scenarios, our best estimates of potential risks and outcomes if history rhymes once again. These include recursive leverage and counterparty vulnerabilities across DeFi (DeFi exploits were front and center again this week), as well as the possibility of ETF or market outflows testing the system. Whether these events occur remains uncertain, but the framework highlights how current dynamics might fit into bitcoin’s recurring pattern of narrative-driven expansion, correction, and renewal.
The Forever Bid
Taken together, the Bitcoin Cycles Narratives Framework and its historical applications reveal a consistent rhythm of belief, leverage, collapse, and renewal, each cycle reshaping the narrative foundation for the next. Yet the pattern itself may one day break — one Presidential tweet could do that. An alternative future could see bitcoin and digital assets maturing beyond cyclical behavior altogether. In this potential Forever Bid era, institutional adoption, regulatory clarity, sovereign participation, and the proliferation of ETFs could transform bitcoin into a structural portfolio staple, a permanent fixture in global capital markets.
In such a world, reflexive boom-and-bust dynamics might give way to steady, persistent demand, driven by long-term allocators rather than short-term speculators. Bitcoin would no longer depend on narrative momentum or liquidity cycles for price support. Instead, it would function as a core, continuously held reserve asset within both private and public balance sheets. Whether that future ultimately materializes remains uncertain, but each successive cycle brings bitcoin closer to institutional permanence, blurring the line between cyclical speculation and structural adoption. Only time will tell if The Forever Bid becomes bitcoin’s final end state.
Market Update

Bitcoin fell 5.3% this week amid broad weakness across global markets, as stocks, gold, bonds, and oil all declined on renewed concerns over valuations and slowing growth. Bitcoin briefly broke above $100K three times but now appears to be finding near-term support around $99K. Whether bitcoin’s historical price cycles are once again repeating remains an open question, one we explore in depth here, but for now, market positioning looks relatively balanced. Funding rates on perpetual swaps remain near normal levels, CME futures basis sits in the mid–single digits, and offshore futures open interest is still 17% below pre–October liquidation levels, suggesting a cautious but stable backdrop.
Important News This Week
Investing:
LLM Crypto Trading Contest Finds LLMs Can’t Trade Crypto - Protos
JPmorgan Sees Bitcoin Price Reaching About $170,000 Within the Next 6 To 12 Months - The Block
Defi Protocol Balancer Potentially Exploited as Onchain Data Shows Millions in Outflows - The Block
Stream Finance Faces $93 Million Loss, Launches Legal Investigation - CoinDesk
Balancer Hit by Apparent Exploit as $110M in Crypto Moves to New Wallets - CoinDesk
Regulation and Taxation:
Full Transcript of Norah O'Donnell's interview with President Trump - CBS
Regulate Web3 Apps, Not Protocols - a16z Crypto
Companies:
Ripple Valued at $40B in Funding Round - CoinDesk
Sequans Dump Nearly a Third of Bitcoin Holdings to Pay Down Debt as BTC Falls to Four-Month Low - The Block
Is Another Piece of Michael Saylor’s BTC Strategy Starting to Fall Into Place? - CoinDesk
Stablecoin Use for Payments Jumps 70% Since US Regulation - Bloomberg
Upcoming Events
Nov 13 (est) - CPI release
Nov 28 - CME Expiry
Dec 10 - FOMC interest rate decision