IN TODAY'S ISSUE:
- Checking in on what our Bitcoin Cycles Narrative Framework says about where we are in the bitcoin cycle.
- We assess the implications as two key sources of bitcoin demand have weakened.
- Assessing what summer seasonality implies for bitcoin returns.
Checking in on the Bitcoin Cycles Narratives Framework
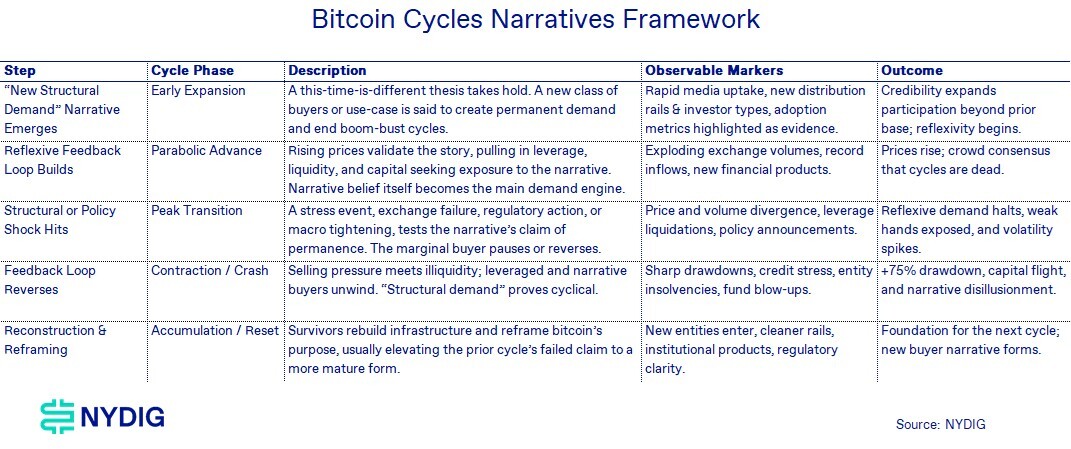
We introduced the Bitcoin Cycles Narratives Framework last November as a conceptual model for understanding Bitcoin’s cyclical evolution. Seven months and a 53% drawdown later, we revisit the framework to assess two questions: whether the model has held up and what it suggests about the path ahead.
On the first question, the framework has performed as expected. Bitcoin has progressed through the phases outlined in the model and currently remains in the contraction phase, precisely where the framework would place it.
That observation provides a partial answer to the second question. While the framework continues to indicate the likely direction of travel, a transition into the reconstruction and reframing phase has not yet occurred. Until that shift becomes evident, the contraction phase remains incomplete, and further downside risk cannot be ruled out.
The Framework Held
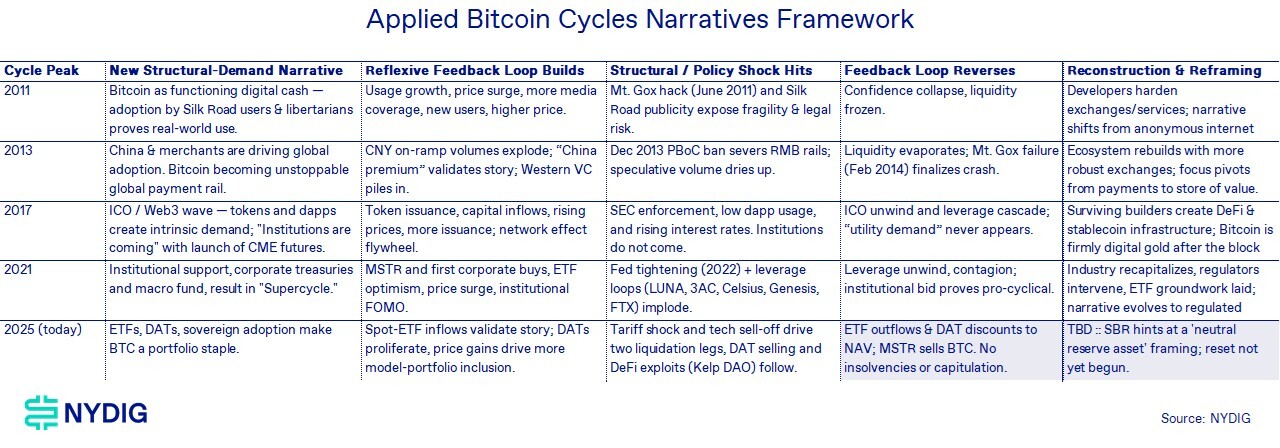
The framework posits a recurring sequence: a structural-demand narrative initiates expansion, reflexive feedback loops accelerate participation and leverage, a shock tests the narrative’s claim of permanence, the cycle reverses, and the remaining participants eventually rebuild around a new foundation. The central prediction was not the specific catalyst, but the repetition of the sequence itself.
The Shocks Played Out
The structural and policy shock phase was already registering when we published. The China-tariff-driven sell-off, a single $19 billion liquidation event, was the opening marker of the Peak Transition. What we posited was that further shocks could follow and keep testing the narrative's claim of permanence. They did. The recycled DeFi leverage we flagged came into play with the April Kelp DAO exploit and the up to $230 million of bad debt it left on Aave. The February tech-equity sell-off proved to be another liquidity event, dragging bitcoin 15% lower in a single session.
The Contraction Is Underway, Not Complete
By the model's own map, we are in Feedback Loop Reverses, and the operative word is underway. The reversal markers are all present: a drawdown of roughly 52% from the October peak, record ETF outflows, DAT mNAV inversion, and Strategy's first bitcoin sale after years of "never sell." But 52% is where we are partway through the phase. It is not a measure of how deep the phase ultimately goes. Prior contractions ran 75% to 85% peak to trough, and the signals that mark a completed contraction are absent here: no long-term-holder capitulation, no terminal insolvencies, and no reset. We have not moved on to Reconstruction and Reframing.
What This Means for the Cycle
The framework's purpose is to locate where we sit and tell us what comes next, and on that it held: the cycle moved through the phases as mapped, and we are mid-contraction with the reset still ahead. The open question is whether this cycle's deeper, more institutional bid, the ETFs, DATs, and sovereign holders, ultimately produces a shallower trough than the 75%-plus template of prior cycles. That can only be confirmed once the contraction completes and reconstruction begins. Until then, the base case is that the drawdown can still extend toward the historical range, and the signal that something has structurally changed would be a durable bottom well above prior-cycle troughs, formed without the capitulation that has always accompanied them before.
Bitcoin Flows: Two Key Sources of Marginal Demand Are Fading
Bitcoin's rally through much of 2025 was supported by two powerful and largely independent sources of demand: spot ETF inflows and corporate treasury accumulation. Together, these buyers consistently absorbed over 10K bitcoins per week, peaking at over 48K bitcoins in a single week, creating a persistent supply sink that drove bitcoin to a peak above $126K in October 2025.

The chart suggests that this demand backdrop has deteriorated materially in 2026. ETF flows have become increasingly inconsistent, while corporate treasury purchases have slowed significantly from 2025 levels. As a result, one of the strongest tailwinds behind bitcoin's prior advance has weakened, leaving prices in the lurch.
Corporate Treasury Demand Has Lost Breadth
The most notable shift has occurred within the corporate buyer cohort. Throughout mid-2025, Digital Asset Treasury ("DAT") companies emerged as a major source of bitcoin demand, with weekly net purchases frequently ranging between 20K and 35K bitcoins. The trade was self-reinforcing, too. Rising bitcoin prices supported equity valuations, elevated equity valuations enabled capital raises, and those proceeds were recycled into additional bitcoin purchases.
That adoption cycle appears to have matured. Weekly corporate purchases in 2026 remain positive in select periods but are considerably less consistent than during the peak of the treasury accumulation phase. More importantly, the buyer base has narrowed substantially. Whereas 2025 was characterized by multiple new entrants pursuing bitcoin treasury strategies, activity in 2026 has become increasingly concentrated around Strategy, with few new large-scale corporate adopters emerging and some corporate treasuries, including miners, becoming net sellers.
ETF Flows Have Shifted from Structural Bid to Tactical Capital
Spot bitcoin ETFs have experienced a similar transition. During much of 2025, ETF flows were persistently positive, with multiple periods of 15K-30K bitcoins of weekly net inflows. Those purchases created a reliable source of demand largely independent of crypto-native sentiment and provided a mechanism for traditional investors to steadily allocate capital into the asset class.
That pattern changed in late 2025 and accelerated in 2026. The chart shows increasingly volatile ETF activity, with inflows frequently offset by periods of significant outflows. Several weeks in Q1 26 and Q2 26 recorded net redemptions approaching 15K-25K BTC, representing a meaningful reversal from the consistent accumulation observed during the prior year.
This shift matters because ETFs have become an important transmission channel between traditional capital markets and bitcoin. When ETF creations slow or turn negative, a key source of incremental demand disappears, reducing the market's ability to absorb new supply and profit-taking activity.
Price Action Is Consistent with Weakening Flow Support
The relationship between flows and price is not perfect on a week-to-week basis, but the broader trend is notable. The strongest period for bitcoin prices coincided with the most robust combination of ETF inflows and corporate treasury accumulation between Q2 25 and Q4 25. Conversely, bitcoin's decline from approximately $126K to $60K occurred alongside a sharp deterioration in aggregate net flows from both groups.
Investment Implications
In 2025, investors benefited from two powerful and expanding sources of structural demand simultaneously. In 2026, both demand engines remain operational but neither is accelerating. Corporate treasury adoption has largely consolidated around a single dominant buyer, while ETF investors have become less consistently additive.
Absent a renewed wave of corporate treasury adoption or a sustained return of ETF inflows, bitcoin is unlikely to receive the same magnitude of mechanical buying support that characterized much of 2025. The key issue is not whether flows remain positive, but whether they are increasing. Based on the data shown, the answer is increasingly no.
Cruel Summer?
Seasonality becomes progressively less supportive as bitcoin moves through the summer months. Average monthly returns decline beginning in April before reaching their low in September. Median returns follow the same trajectory.
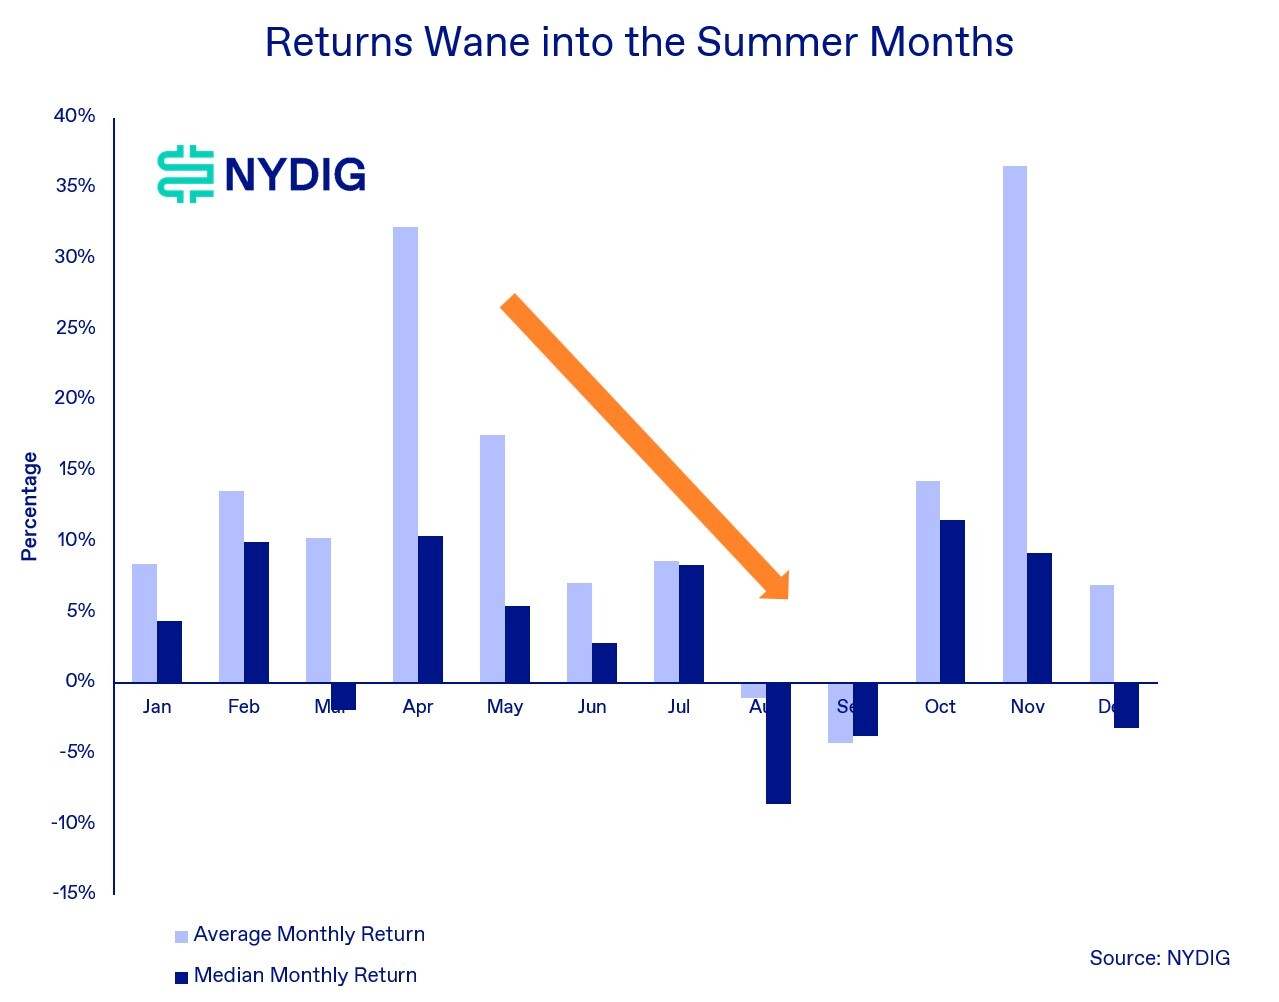
The key takeaway is not that summer months must produce negative returns, but that the distribution of outcomes becomes less favorable. Historically, lower trading activity, reduced liquidity, and a scarcity of major catalysts have coincided with weaker price performance between May and September.
August and September stand out as bitcoin’s weakest seasonal months, with both average and median returns negative. The pattern has historically reversed in October, when average returns improve, marking the beginning of a stronger seasonal window that extends into year-end.
For a market already in contraction, seasonality represents an additional headwind. If historical patterns persist, the seasonal backdrop suggests downside risk may remain elevated through the summer before conditions become more supportive in the fourth quarter.
Market Update
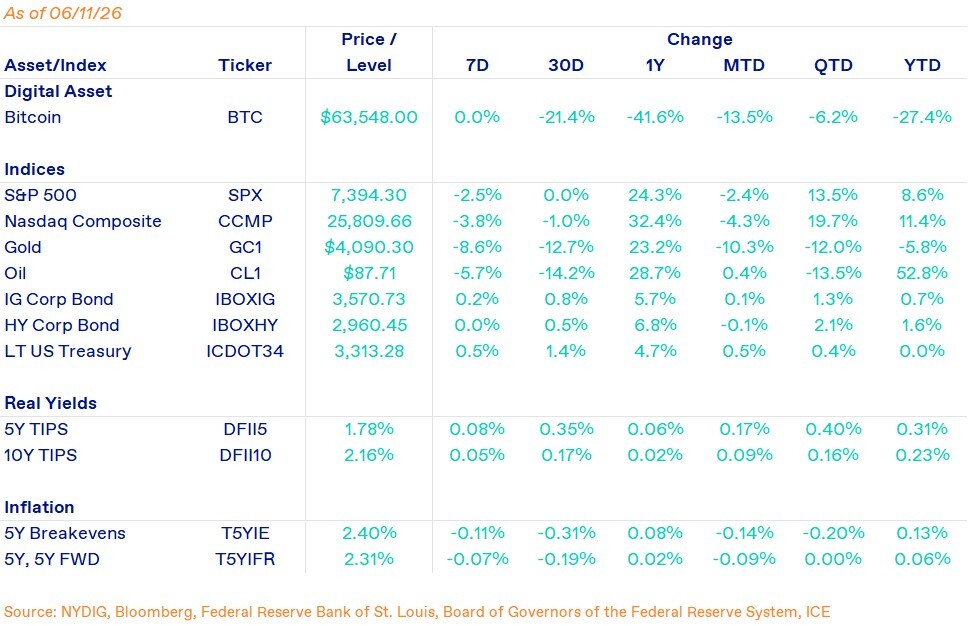
Bitcoin bounced from last Friday’s new cycle low of $59,073 to $63,548 at Thursday’s close, as deeply oversold momentum created the setup for a short-term reversal. The 14D RSI closed at 15.5 on Saturday, a level reached only once before in bitcoin’s trading history.
But the recovery looks tactical rather than durable given continued ETF redemptions and stablecoin outflows. Spot bitcoin ETFs have seen $6.4B of redemptions since May 7, with only two positive flow days since outflows began, while stablecoin balances have fallen $8B since May 22. Bitcoin was tactically oversold, but the fundamentals are not yet repaired as sustained upside likely requires ETF inflows to resume or stablecoin balances to stabilize.
Perpetual swap open interest in BTC terms has risen 14% since mid-March despite flat-to-negative funding, indicating shorts have likely built into the decline. CME front-month basis remains in the low single digits, and ETH/SOL basis is negative, showing limited institutional carry demand across crypto.
Important News This Week
Regulation and Politics:
Under the Trump Crypto Playbook, the Family Always Wins. Investors Don’t. - Reuters
Companies:
Michael Saylor Gets into Public Debate Over Claims that Strategy's Latest Share Sale was Dilutive - CoinDesk
Upcoming Events
June 17 - FOMC interest decision
June 26 - CME expiry
July 14 - CPI report