
UX Design & Webflow Agency NYC | Composite Global
All Posts

Q2 2026 Review: Leverage, Not Spot Demand, Is Driving Bitcoin While Value and Momentum Buyers Wait

Share

Greg Cipolaro

July 10, 2026

PDF
Download the full letter to print or read anytime
Download
PDF
Download the full letter to print or read anytime
Download

IN TODAY'S ISSUE:

  • Bitcoin's -32.9% YTD return is now driven more by supply mechanics than risk sentiment. Tech equities gained 43.5% and the Nasdaq 100 rose 27.7% in the same quarter bitcoin fell 13.4%, reinforcing that the drawdown is bitcoin-specific, not a broad risk-off event.
  • The DAT complex flipped from demand engine to supply risk. MSTR’s $1.25B BTC monetization authorization is the company’s first formal sell mechanism, changing the dynamics for the largest historical marginal buyer.
  • Distribution beat incumbency in Q2 ETF flows as Morgan Stanley's new BTC ETF pulled in $364.8M while the remaining spot BTC ETF complex lost $5.3B in flows, demonstrating a mature ETF market still has room for a new entrant with the right distribution channel.
  • Derivatives are rebuilding leverage into a weak spot market. Positive funding and rising open interest near cycle lows signal longs re-adding exposure without ETF or stablecoin confirmation, as both are showing outflows. This is a troubling setup for a liquidation-driven leg lower, not a durable bottom.
  • CLARITY Act's July 13 - August 7 Senate floor window is the last realistic shot before recess and midterm politics harden opposition. Ethics language, increasingly complicated by Trump's $1.4B+ disclosed crypto income, is a sticking point to watch, while stablecoin yield opposition by banks continues to hamper broad support.
  • The 4-year cycle framework points to a $38K-$39K low near early October if the current drawdown matches the depth/duration pattern of 2018 and 2022 (progressively shallower troughs, ~70% decline, ~370 days).
  • Bitcoin is caught between two buyer bases with neither having their buying conditions met.  The 54.3% drawdown isn't deep enough for a full cycle retrace, and on-chain metrics aren't at capitulation lows to draw in value buyers. ETF and stablecoin flows haven't turned to confirm a trend reversal for momentum buyers, and the main industry catalyst, CLARITY Act passage, is at best a coin flip.

Strategy: The Bitcoin-Backed Capital Markets Flywheel Meets Its First Real Test

PERFORMANCE REVIEW

Bitcoin Falls Despite a Broad Risk Asset Rally

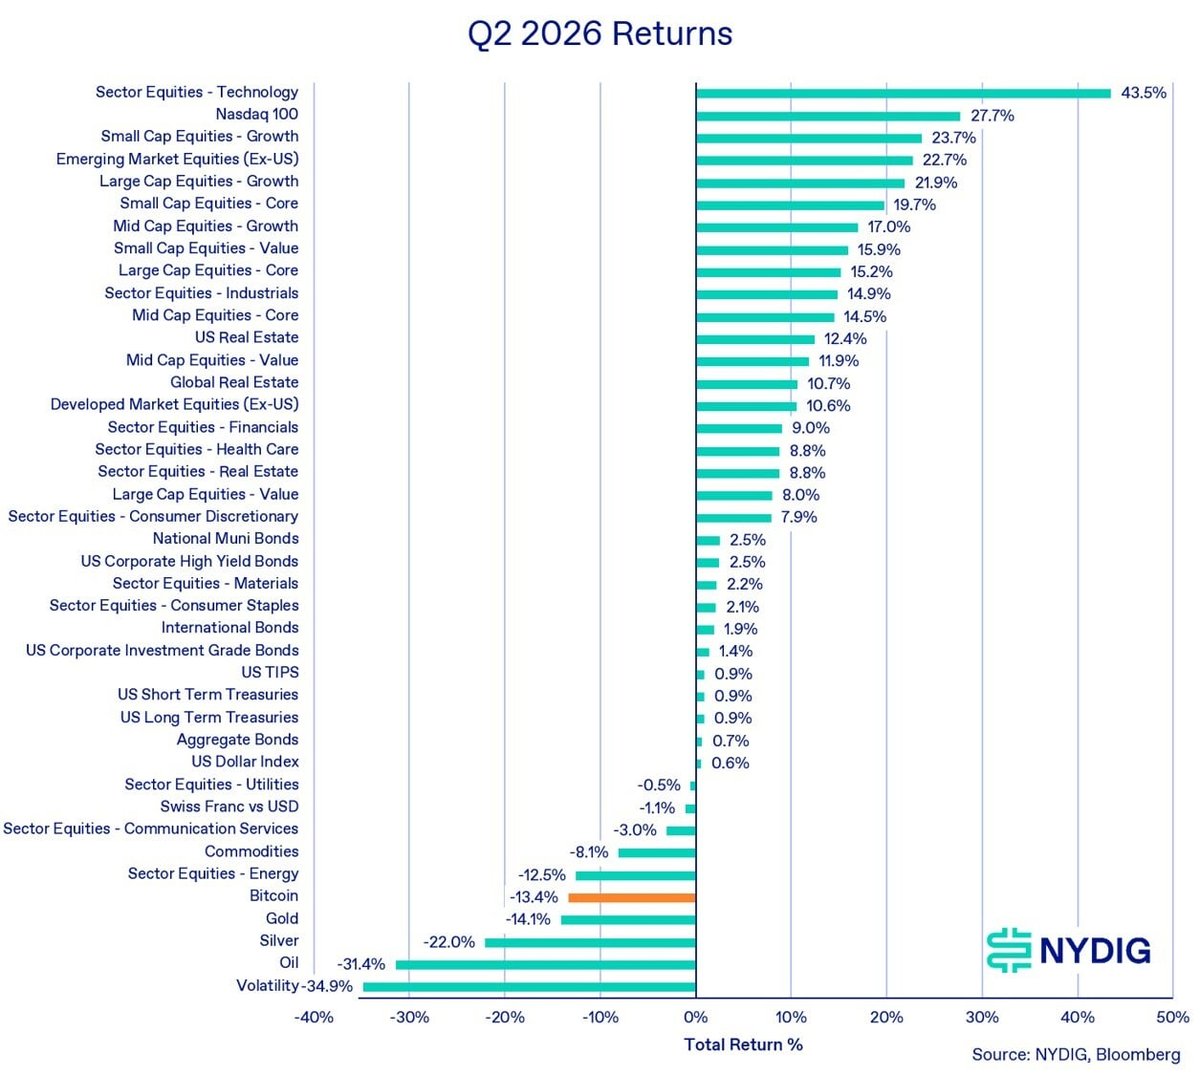
Bitcoin had another difficult quarter, falling 13.4% in Q2 after declining 22.6% in Q1, bringing its year-to-date return to -32.9%. The weakness was notable because broader risk markets rallied sharply, led by technology equities, which gained 43.5%, and the Nasdaq 100, which rose 27.7%. Growth equities were also strong, with small-cap growth up 23.7%, emerging market equities ex-U.S. up 22.7%, and large-cap growth up 21.9%.

The divergence suggests bitcoin’s Q2 weakness was not driven by a broad collapse in risk appetite. Instead, performance largely reflected bitcoin-specific supply concerns, particularly around digital asset treasury companies, alongside tighter liquidity expectations following a hawkish shift in monetary policy. The result was a quarter in which bitcoin behaved less like high-beta technology and more like a pressured hard-asset allocation.

Commodities also struggled during the quarter, with oil down 31.4% and energy equities down 12.5% as the geopolitical risk premium tied to the Iran conflict faded. Precious metals also sold off sharply, with silver down 22.0% and gold down 14.1%, as the “debasement trade” that helped drive assets to new highs in Q1 lost momentum. The reversal was more sentiment-driven than macro-driven, because inflation remained stubborn while the U.S. Dollar rallied on more hawkish Fed expectations under Chair Kevin Warsh.
Weekly 1-Jul-10-2026-01-39-08-5516-PM

Annual Returns Show the Depth of the 2026 Reset

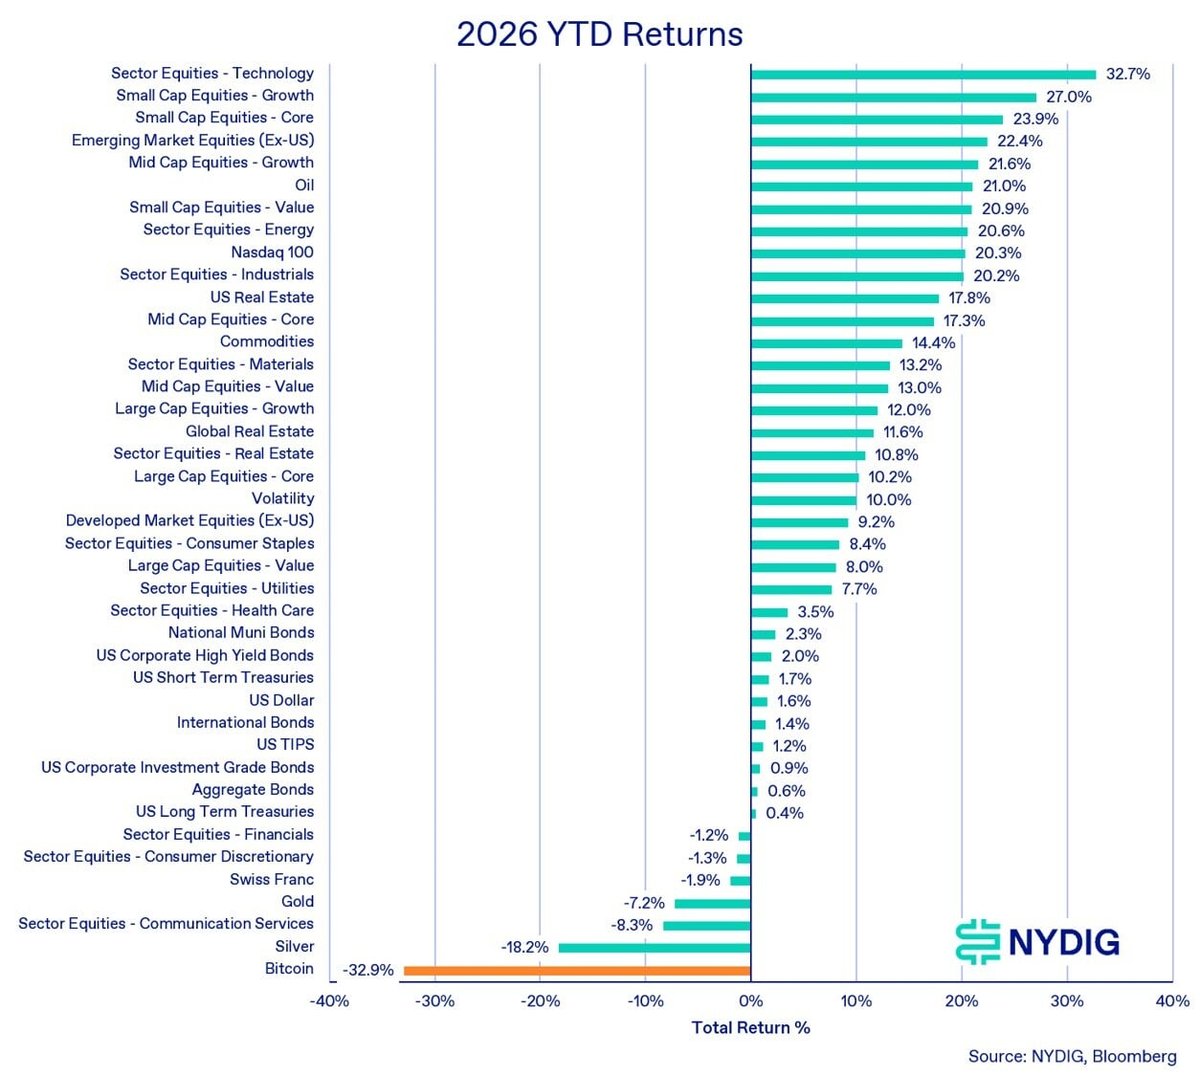
The year-to-date cross-asset ranking highlights the severity of the underperformance.  Bitcoin’s -32.9% year-to-date return places 2026 at the bottom of the annual return table, with the first-half drawdown creating a larger recovery hurdle than most prior positive full-year reversals. The key driver is the sequencing of losses, because back-to-back quarterly declines of -22.6% and -13.4% leave bitcoin more dependent on a second-half improvement in marginal demand than in typical weak-start recovery years.

The bearish annual-return thesis would be invalidated by a sustained recovery in DAT buying, ETF inflows, or liquidity conditions large enough to offset the -32.9% first-half decline. The investment implication is that bitcoin now needs a material demand inflection to avoid joining the small subset of negative annual return years.
Weekly 2-Jul-10-2026-01-39-57-8017-PM

Weak Q2 by Historical Standards, Extending a Difficult Start to 2026

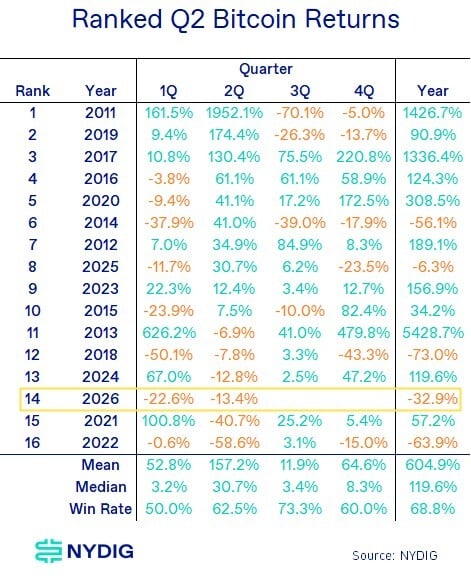
From a historical perspective, Q2 2026 was one of bitcoin’s weaker second quarters, with a return of -13.4%, ranking 14th out of 16 observed years. This outcome was well below the historical Q2 median of 30.7%, which is the cleaner benchmark because upside outliers distort the mean. Only 2021, at -40.7%, and 2022, at -58.6%, posted weaker second-quarter returns in the sample.

The second-half setup is less supportive than the Q2 seasonal profile, because Q3 has a higher historical win rate at 73.3% but a much lower median return of 3.4%, while Q4 has a somewhat better median return of 8.3% but a lower win rate of 60.0%. This mix leaves a limited seasonal recovery cushion. However, seasonality alone is not likely to be a driver of forward returns. Bitcoin needs a demand-driven recovery in DAT buying, ETF inflows, or liquidity conditions to pull out of the first-half drawdown.
Weekly 3-Jul-10-2026-01-43-18-3192-PM

Equity Correlations Remain High, but Long-Term Correlations Stay Low

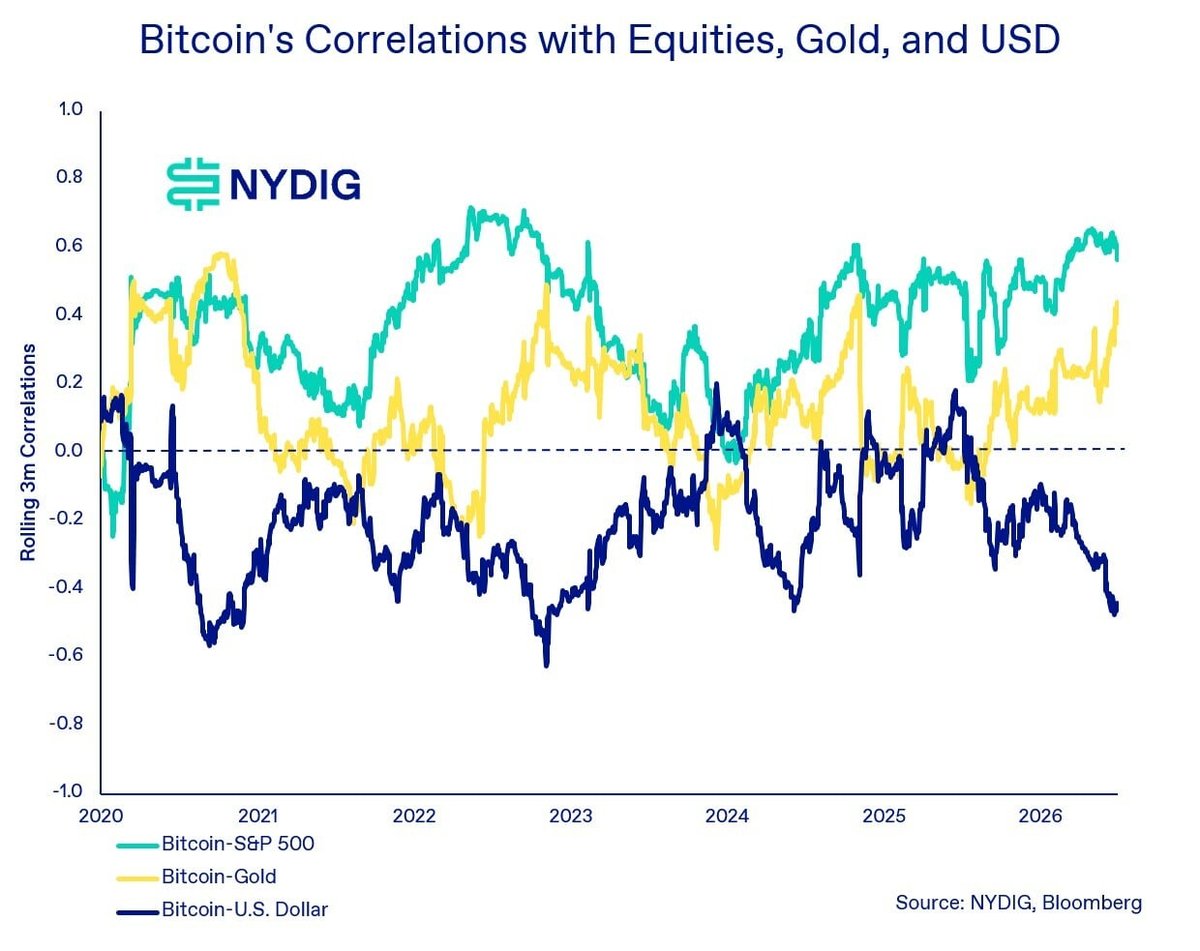
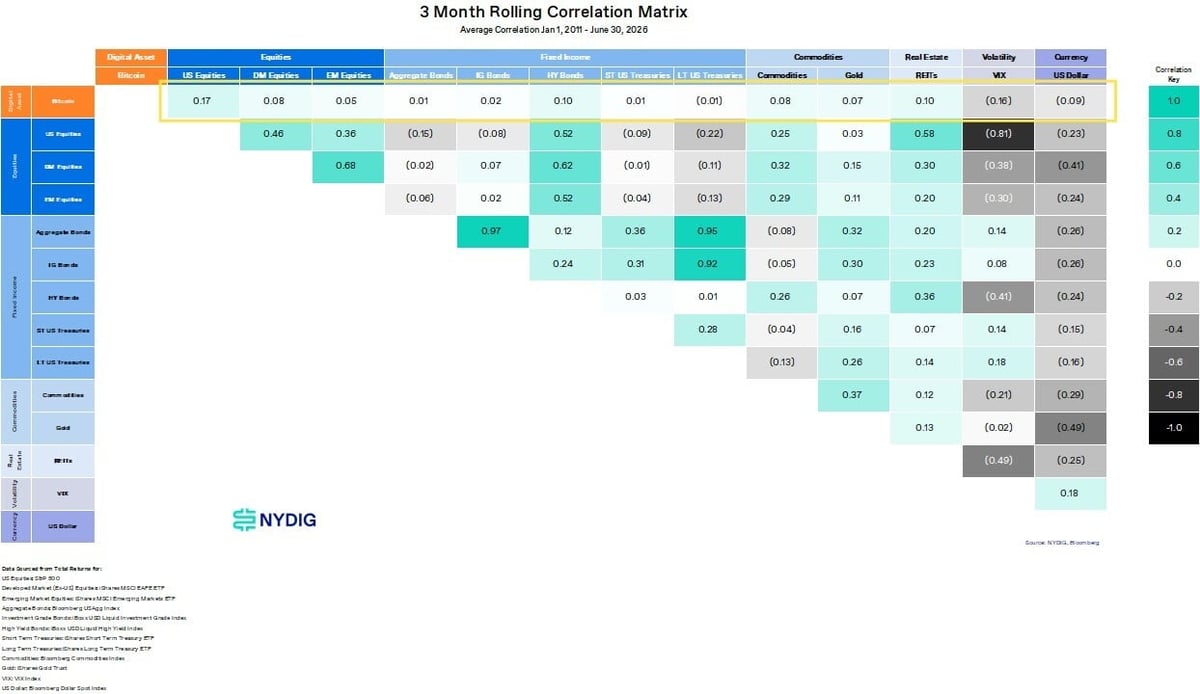
Bitcoin’s relationship with traditional macro assets remained mixed in Q2. Its rolling 3-month correlation with the S&P 500 stayed elevated, ending near the upper end of the post-2020 range. This reinforces the view that bitcoin continues to trade as a liquidity-sensitive risk asset over shorter horizons, particularly when monetary policy expectations and growth-equity narratives dominate markets.

At the same time, bitcoin did not participate in the Q2 equity rally despite that elevated correlation. This disconnect suggests that short-term correlations are not sufficient to explain performance when bitcoin-specific flows become the dominant driver. In Q2, DAT-related selling concerns and tighter policy expectations outweighed the positive signal from stronger technology and growth equities.

Bitcoin’s rolling correlation with gold also increased during the quarter as both assets declined materially. The rolling correlation with the U.S. dollar remained negative, consistent with the historical pattern that dollar strength and tighter liquidity tend to weigh on bitcoin demand yet be supportive for the dollar.
Weekly 4-Jul-10-2026-01-44-09-0977-PM
Weekly 5-Jul-10-2026-01-44-26-9272-PM
Weekly 6-Jul-10-2026-01-50-42-1469-PM

Regulation Front and Center with the CLARITY Act

U.S. crypto regulation moved to the center of the Q2 narrative, but even though the CLARITY Act cleared committee markup with provisional support, its ultimate passage is still very much up in the air. The committee vote marked a measurable change versus the prior quarter’s legislative setbacks, but the bill remains highly uncertain because ethics-related objections emerged as a clear unresolved sticking point after committee review. In addition, bank lobbying groups continue to oppose the bill because language around stablecoins paying yield is not sufficiently restrictive to limit platform workarounds, which, in their eyes, could result in deposit flight from banks to digital dollars.

Fed Transition Turns into a Liquidity Headwind

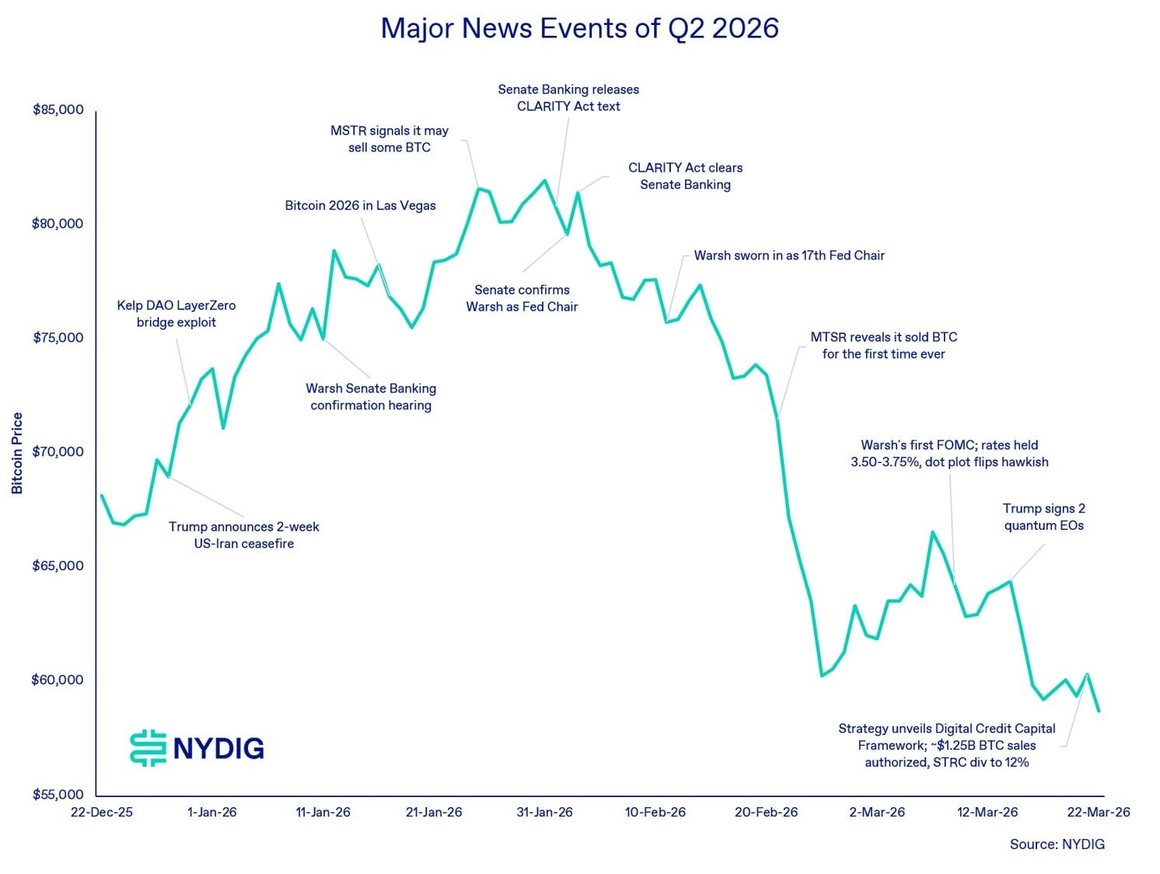
Monetary policy remained a key pressure point in Q2 as Warsh was confirmed by the Senate, sworn in as the 17th Fed Chair, and then presided over his first FOMC meeting. Rates were held firm, but the dot plot (forward rate projections) shifted hawkish. That combination pressured bitcoin because higher real-rate expectations reduce the attractiveness of long-duration, non-cash-flowing assets.

Bitcoin reached its quarterly peak around Warsh’s confirmation, making the leadership transition a timing marker for the subsequent liquidity-driven drawdown. From there, bitcoin moved from the low $80,000s toward the low $60,000s and finished below that level by quarter-end, indicating that tighter liquidity expectations outweighed equity-market strength. The investment implication is that bitcoin remains highly sensitive to marginal liquidity driven by the restrictive policy signal.

Strategy/MSTR Shifts the DAT Flow Narrative

The most important bitcoin-specific development in Q2 was the shift in the Strategy (MSTR) narrative. Earlier in the quarter, MSTR signaled it may sell some BTC, which introduced uncertainty around a buyer that had previously been viewed as a persistent source of demand. Later in the quarter, MSTR revealed that it had sold BTC, further pressuring sentiment.

The flow concern intensified when Strategy unveiled its Digital Credit Capital Framework, with approximately $1.25B of BTC sales authorized and the STRC dividend increased to 12%. This mattered because digital asset treasury companies (DATs) had been an important marginal buyer in prior quarters, and a shift from accumulation to potential supply changes the market’s clearing dynamics. The result was a quarter in which DATs collectively became a source of sell-side pressure rather than a reliable demand engine.

Commodities and Precious Metals Weaken as the Debasement Trade Reversed

Q2 weakness across commodities and precious metals reflected different drivers, with oil down 31.4% as Trump’s U.S.-Iran ceasefire reduced the geopolitical risk premium, while gold and silver fell 14.1% and 22.0% as hawkish monetary policy pressured non-yielding assets through higher real-rate expectations. The same dynamic marked a reversal of the debasement trade, because assets that had benefited from fiscal, currency, and geopolitical hedging demand at the start of the year underperformed once markets repriced toward tighter policy and lower tail-risk demand.

Bitcoin declined alongside precious metals rather than benefiting from the unwind in geopolitical stress, indicating that Q2 price action was driven more by liquidity sensitivity than by safe-haven demand. The investment implication is that bitcoin’s near-term hard-asset narrative weakened during the quarter, because lower geopolitical risk, regulatory progress, and strong equity markets were not enough to offset tighter policy expectations and softer structural demand.

Quantum Computing and the Executive Orders

Quantum computing became a more visible policy risk in Q2 after Trump signed 2 quantum-focused executive orders, raising institutional attention on a long-dated threat to public-key cryptography. The near-term technical risk to Bitcoin remains limited, but the governance risk is material because any future migration to quantum-resistant cryptography would require coordination across developers, miners, custodians, exchanges, and users. The investment implication is that quantum risk is unlikely to drive near-term bitcoin pricing, but it can remain an allocation-committee issue because protocol upgrade coordination becomes more important as policy attention increases.

DeFi Risk and the KelpDAO Hack

The KelpDAO LayerZero bridge exploit kept DeFi security risk in focus during Q2, with the event highlighting a more systemic industry issue rather than a single-protocol failure. The core risk is that DeFi capital often depends on shared middleware, bridges, cross-chain messaging, and composable smart contracts, so one exploit can affect confidence across multiple protocols and balance-sheet linkages. This is not a Bitcoin protocol failure, but it can still widen the institutional risk premium for broader digital assets because allocators often treat DeFi hacks as evidence of operational and infrastructure fragility across the asset class. The investment implication is that DeFi security remains a gating factor for institutional adoption, particularly when risk controls, insurance coverage, and audit standards lag the complexity of cross-chain infrastructure.

Bitcoin 2026 Conference Highlights Industry Activity Despite Weak Price Action

Bitcoin 2026 in Las Vegas served as a reminder that industry activity and price performance can diverge sharply over short periods. The conference occurred during a quarter when regulatory progress was made, and institutional conversations and building remained active, but bitcoin still fell. That gap suggests the market was focused less on long-term adoption narratives and more on immediate flow pressure from DATs and tighter monetary policy.

The broader implication is that industry development continues, but bitcoin’s price remains highly sensitive to marginal demand and forced or discretionary supply. Q2 showed that adoption narratives can support long-term conviction, but they do not prevent drawdowns when large holders are perceived as potential sellers.

Bitcoin’s 4-Year Cycle Comes Back into View

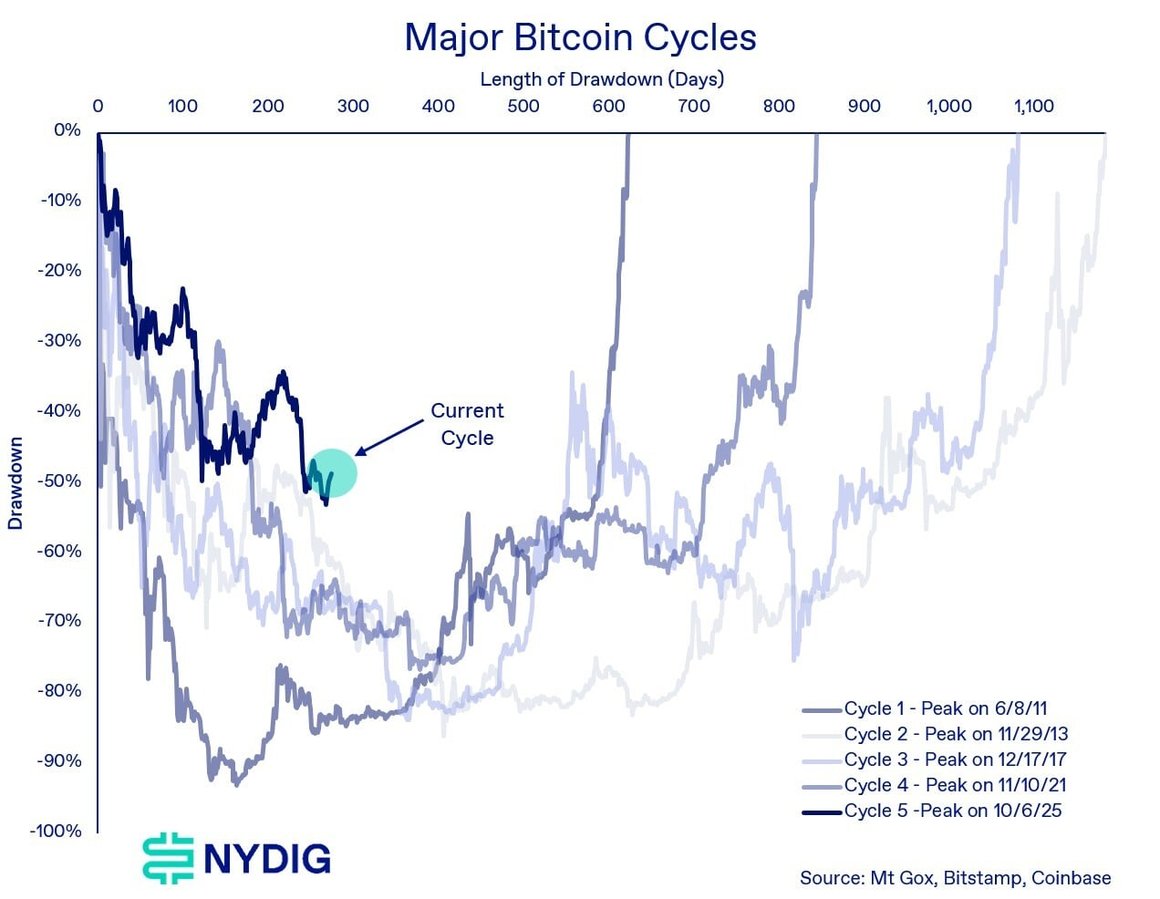
Bitcoin’s 2025–2026 drawdown is bringing the 4-year cycle narrative back into focus, because the timing and structure increasingly resemble the prior reset years of 2014, 2018, and 2022 even though the path has not matched those drawdowns exactly. Bitcoin is now down 54.3% from the $126K all-time high set on 10/6/25, with new cycle lows probed around the quarter-end window as bitcoin reached $57,717.55 on July 1. The drawdown has now extended to 268 days, reinforcing the view that the reset remains active rather than complete.

The historical framework matters because the 2 most recent major cycle drawdowns lasted 363 and 376 days and reached trough depths of -84.3% and -77.6%, respectively. A repeat of that duration profile with a narrower -70% drawdown, consistent with the pattern of progressively shallower cycle troughs, would imply a potential cycle low near $38K–$39K around early October. This is a scenario rather than a base-case forecast, but it illustrates why the 4-year cycle narrative is becoming more relevant as the current drawdown extends in both depth and duration.

Weekly 8-Jul-10-2026-02-47-00-1269-PM

ETF Outflows Show Weak Spot Demand, but Morgan Stanley Launch Stands Out

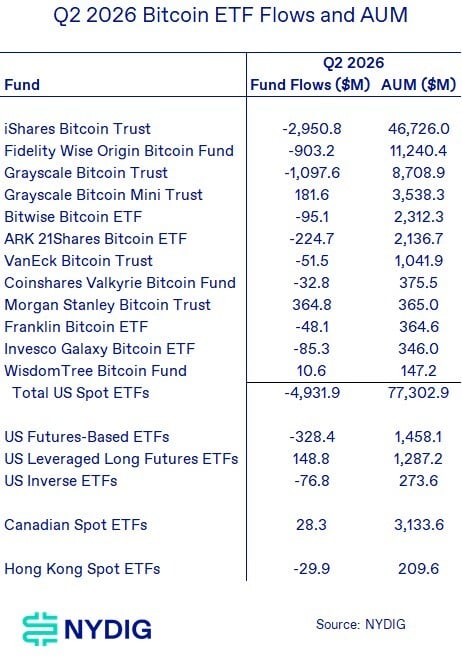
Q2 bitcoin ETF flows were a clear source of pressure, with total U.S. spot ETFs posting $4.9B of net outflows during the quarter. The outflows were concentrated in the largest incumbent products, with iShares Bitcoin Trust down $2.95B, Grayscale Bitcoin Trust down $1.10B, and Fidelity Wise Origin Bitcoin Fund down $903.2M, meaning the 3 largest outflow contributors accounted for $4.95B of redemptions before smaller fund-level offsets.

The notable exception was the Morgan Stanley Bitcoin Trust, which attracted $364.8M of inflows and ended Q2 with $365.0M of AUM. That launch demonstrates that distribution still matters. Morgan Stanley was able to attract inflows even amidst a crowded market and against a backdrop where most funds, especially the large incumbents, showed large outflows.

Weekly 7-Jul-10-2026-02-48-24-7745-PM

Iran Risk Premium Fades in Q2, Then Flares Up Again

The Iran conflict was a fading risk premium for most of Q2, with oil down 31.4% as markets reduced the probability of a sustained supply disruption and unwound the geopolitical premium that had supported energy prices earlier in the year. More recently, however, the Iran risk premium has flared back up after the July 8 ceasefire breakdown pushed Brent crude roughly 5%–6% higher toward $78–$79 per barrel. For bitcoin, the renewed risk is indirect because higher oil prices can raise inflation expectations, reduce the probability of Fed easing, and tighten real-rate conditions for non-cash-flowing assets. The investment implication is that renewed Iran escalation is a near-term headwind unless bitcoin begins to trade alongside gold and oil, because that would signal a shift from liquidity-sensitive risk asset toward geopolitical hedge demand.

LOOKING AHEAD

CLARITY is the Key Industry Catalyst

The CLARITY Act is the most important forward catalyst for the digital asset industry because it could establish a federal market-structure framework for exchanges, stablecoins, tokenization, custody, DeFi, and future non-bitcoin ETF approvals. The bill advanced out of the Senate Banking Committee by a 15–9 vote on May 14 and now moves to the Senate floor, making the next stage more consequential than prior committee-level progress. The timing is critical because the Senate’s current legislative window effectively runs from July 13 through August 7, followed by a recess until September 14, after which midterm politics should make contentious legislation harder to pass before November.

The main unresolved issue coming out of committee remains ethics language, with Democrats pushing provisions that would limit the ability of public officials to profit from sponsoring, endorsing, or otherwise benefiting from crypto assets while digital asset legislation is pending. That issue is likely to receive more scrutiny after President Trump’s 2025 financial disclosure that showed more than $1.4B of crypto-related income.

The second sticking point is stablecoin yield, because the GENIUS Act created a federal payment-stablecoin regime but left a gap between issuer-level yield bans and affiliate or exchange-level reward programs. GENIUS prohibits permitted stablecoin issuers from paying interest or yield directly to holders, but it does not explicitly ban affiliates or third parties from offering interest-like rewards, which banks argue could accelerate deposit flight from insured deposits into tokenized dollars. CLARITY includes potential fixes to narrow that channel, but the banking industry’s effective position remains opposition to yield in any form because stablecoins are competitive with bank deposits yet offer fewer protections for depositors.

For bitcoin, CLARITY’s direct price impact is less significant than for altcoins and crypto equities, but the investment implication remains material because a clearer U.S. market-structure regime would benefit the entire industry. Passage would likely be most supportive for crypto-linked equities, exchanges, custody platforms, tokenization infrastructure, and non-bitcoin ETF candidates, but bitcoin would still benefit if the bill improves institutional confidence and expands the investable digital asset universe. If CLARITY stalls, crypto would remain in a vulnerable state because the industry would be left without the legislative clarity it has sought since 2017, leaving agencies to rely on interpretive guidance and rulemaking that can change across administrations and falls short of durable statutory clarity.

Flows Need to Confirm Demand

Flows are the main confirmation signal for whether bitcoin demand is stabilizing after a weak first half, because ETF flows measure spot demand through traditional rails while stablecoin supply measures on-chain dollar liquidity available for deployment across the broader digital asset ecosystem. Both signals deteriorated during the drawdown, with U.S. spot bitcoin ETFs posting $4.9B of Q2 net outflows and total stablecoin market capitalization falling to roughly $311B from a late-May peak near $322B. That roughly $11B stablecoin contraction reinforces the ETF message: marginal capital has been leaving the system rather than building liquidity for immediate redeployment.

The forward setup is straightforward because bitcoin likely needs sustained ETF inflows and renewed stablecoin supply growth to climb out of the current drawdown. A rally without improving ETF flows or stablecoin supply would be less durable because it would likely reflect leverage, short covering, or positioning rather than fresh capital formation. The investment implication is that flows are the confirmation test for any recovery. Sustained ETF inflows and rising stablecoin supply would support a demand-led rebound, while continued ETF outflows or flat stablecoin balances would reinforce the view that the reset remains incomplete.

Derivatives Positioning Shows Long-Skewed Leverage Rebuilding

Derivatives positioning remains fragile because futures open interest has rebuilt while bitcoin remains near cycle lows. Open interest is not directional by itself because every futures contract has both a long and a short, but the combination of rising open interest, positive funding, and weak price action suggests long-skewed leverage is being rebuilt. That matters because leveraged longs are adding exposure before spot demand has confirmed a recovery through ETF inflows or stablecoin supply growth.

Funding rates reinforce the same point because perpetual funding has moved back into positive territory, meaning longs are paying shorts to maintain exposure. A cleaner reset would likely show lower open interest, neutral-to-negative funding, and improving spot demand. The current setup instead shows leverage rebuilding while bitcoin remains far below its October 2025 high.

glassnode-studio_fund-rates-futures-oi (1)

The investment implication is that derivatives positioning is a risk amplifier rather than a recovery confirmation signal. If ETF flows and stablecoin supply improve, long-skewed leverage could help extend a rebound. If spot demand remains weak, elevated open interest and positive funding increase the risk of another liquidation-driven move lower.

DAT and MSTR Supply Remain the Key Bitcoin-Specific Overhang

DATs remain the most important bitcoin-specific variable because the DAT complex shifted in Q2 from a source of structural demand to a potential source of supply. Strategy, the most important company in the DAT complex, recently announced a Digital Credit Capital Framework that authorizes bitcoin monetization to fund the USD reserve, preferred dividends, interest expense, and security repurchases. That changed the narrative from one-way accumulation to active balance-sheet management.

This matters because DAT buying had been an important marginal demand source in prior quarters, and even limited monetization can pressure sentiment when spot demand is already fragile. The market does not need DATs to become aggressive sellers for the overhang to matter; the risk premium widens once investors believe large holders may sell into weakness to meet capital-structure obligations.

The bearish risk is that DAT discounts widen, preferred dividend obligations remain expensive, and bitcoin monetization becomes recurring rather than episodic. However, MSTR has retained a slight premium to NAV despite putting bitcoin sales on the table and executing limited monetization, which suggests investors have not fully abandoned the DAT model.

Fed Liquidity and the Iran Risk Premium Remain Macro Pressure Points

Fed liquidity remains the main macro variable for bitcoin because higher real-rate expectations reduce the relative attractiveness of non-cash-flowing assets. The next FOMC interest rate decision is scheduled for July 29, which makes the July inflation and growth data more important for bitcoin than normal because the asset is already trading with a liquidity-sensitive profile.

The Iran conflict adds a second macro channel because the geopolitical risk premium faded through most of Q2 but then flared up again after a renewed July escalation. For bitcoin, the transmission channel is indirect because higher oil prices can lift inflation expectations, delay Fed easing, and tighten real-rate conditions. That makes renewed Iran escalation a near-term headwind.

Cycle Risk Remains Unresolved

The 4-year cycle framework remains relevant because bitcoin has fallen 54.3% at its low from the $126K all-time high set on October 6, 2025, while the drawdown continues to extend, now reaching 268 days. The 2 most recent major cycle drawdowns lasted 363 and 376 days and reached trough depths of -84.3% and -77.6%, respectively, leaving investors to determine whether the current reset is incomplete or simply shallower than prior cycles.

The current drawdown is unsatisfactory from a market-structure perspective because price has not fallen far enough to attract value buyers who believe a durable bottom is in, while the catalyst set remains too thin and the risk too big for momentum traders to reallocate capital aggressively. On-chain metrics confirm this incomplete reset phase, with several cyclical indicators (MVRV, PSIP, aSOPR, LTH SOPR) still above the trough levels that have historically marked durable bitcoin bottoms. That leaves bitcoin stuck between 2 buyer bases, with value investors waiting for either deeper capitulation or stronger bottoming evidence, and momentum investors waiting for confirmation through investment catalysts.

A narrower drawdown than prior cycles remains plausible if CLARITY advances, ETF inflows recover, DAT demand stabilizes, or a new marginal purchaser group emerges. A deeper or longer reset remains plausible if CLARITY stalls, ETF outflows persist, DAT monetization continues, and Fed policy remains restrictive.

The investment implication is that downside risk remains elevated until demand drivers improve, because the current price level does not yet offer enough valuation support to pull in value buyers or enough upside confirmation to attract momentum capital.

Start Reading
Start Reading

IN TODAY'S ISSUE:

  • Bitcoin's -32.9% YTD return is now driven more by supply mechanics than risk sentiment. Tech equities gained 43.5% and the Nasdaq 100 rose 27.7% in the same quarter bitcoin fell 13.4%, reinforcing that the drawdown is bitcoin-specific, not a broad risk-off event.
  • The DAT complex flipped from demand engine to supply risk. MSTR’s $1.25B BTC monetization authorization is the company’s first formal sell mechanism, changing the dynamics for the largest historical marginal buyer.
  • Distribution beat incumbency in Q2 ETF flows as Morgan Stanley's new BTC ETF pulled in $364.8M while the remaining spot BTC ETF complex lost $5.3B in flows, demonstrating a mature ETF market still has room for a new entrant with the right distribution channel.
  • Derivatives are rebuilding leverage into a weak spot market. Positive funding and rising open interest near cycle lows signal longs re-adding exposure without ETF or stablecoin confirmation, as both are showing outflows. This is a troubling setup for a liquidation-driven leg lower, not a durable bottom.
  • CLARITY Act's July 13 - August 7 Senate floor window is the last realistic shot before recess and midterm politics harden opposition. Ethics language, increasingly complicated by Trump's $1.4B+ disclosed crypto income, is a sticking point to watch, while stablecoin yield opposition by banks continues to hamper broad support.
  • The 4-year cycle framework points to a $38K-$39K low near early October if the current drawdown matches the depth/duration pattern of 2018 and 2022 (progressively shallower troughs, ~70% decline, ~370 days).
  • Bitcoin is caught between two buyer bases with neither having their buying conditions met.  The 54.3% drawdown isn't deep enough for a full cycle retrace, and on-chain metrics aren't at capitulation lows to draw in value buyers. ETF and stablecoin flows haven't turned to confirm a trend reversal for momentum buyers, and the main industry catalyst, CLARITY Act passage, is at best a coin flip.

Strategy: The Bitcoin-Backed Capital Markets Flywheel Meets Its First Real Test

PERFORMANCE REVIEW

Bitcoin Falls Despite a Broad Risk Asset Rally

Bitcoin had another difficult quarter, falling 13.4% in Q2 after declining 22.6% in Q1, bringing its year-to-date return to -32.9%. The weakness was notable because broader risk markets rallied sharply, led by technology equities, which gained 43.5%, and the Nasdaq 100, which rose 27.7%. Growth equities were also strong, with small-cap growth up 23.7%, emerging market equities ex-U.S. up 22.7%, and large-cap growth up 21.9%.

The divergence suggests bitcoin’s Q2 weakness was not driven by a broad collapse in risk appetite. Instead, performance largely reflected bitcoin-specific supply concerns, particularly around digital asset treasury companies, alongside tighter liquidity expectations following a hawkish shift in monetary policy. The result was a quarter in which bitcoin behaved less like high-beta technology and more like a pressured hard-asset allocation.

Commodities also struggled during the quarter, with oil down 31.4% and energy equities down 12.5% as the geopolitical risk premium tied to the Iran conflict faded. Precious metals also sold off sharply, with silver down 22.0% and gold down 14.1%, as the “debasement trade” that helped drive assets to new highs in Q1 lost momentum. The reversal was more sentiment-driven than macro-driven, because inflation remained stubborn while the U.S. Dollar rallied on more hawkish Fed expectations under Chair Kevin Warsh.

Weekly 1-Jul-10-2026-01-39-08-5516-PM

Annual Returns Show the Depth of the 2026 Reset

The year-to-date cross-asset ranking highlights the severity of the underperformance.  Bitcoin’s -32.9% year-to-date return places 2026 at the bottom of the annual return table, with the first-half drawdown creating a larger recovery hurdle than most prior positive full-year reversals. The key driver is the sequencing of losses, because back-to-back quarterly declines of -22.6% and -13.4% leave bitcoin more dependent on a second-half improvement in marginal demand than in typical weak-start recovery years.

The bearish annual-return thesis would be invalidated by a sustained recovery in DAT buying, ETF inflows, or liquidity conditions large enough to offset the -32.9% first-half decline. The investment implication is that bitcoin now needs a material demand inflection to avoid joining the small subset of negative annual return years.

Weekly 2-Jul-10-2026-01-39-57-8017-PM

Weak Q2 by Historical Standards, Extending a Difficult Start to 2026

From a historical perspective, Q2 2026 was one of bitcoin’s weaker second quarters, with a return of -13.4%, ranking 14th out of 16 observed years. This outcome was well below the historical Q2 median of 30.7%, which is the cleaner benchmark because upside outliers distort the mean. Only 2021, at -40.7%, and 2022, at -58.6%, posted weaker second-quarter returns in the sample.

The second-half setup is less supportive than the Q2 seasonal profile, because Q3 has a higher historical win rate at 73.3% but a much lower median return of 3.4%, while Q4 has a somewhat better median return of 8.3% but a lower win rate of 60.0%. This mix leaves a limited seasonal recovery cushion. However, seasonality alone is not likely to be a driver of forward returns. Bitcoin needs a demand-driven recovery in DAT buying, ETF inflows, or liquidity conditions to pull out of the first-half drawdown.

Weekly 3-Jul-10-2026-01-43-18-3192-PM

Equity Correlations Remain High, but Long-Term Correlations Stay Low

Bitcoin’s relationship with traditional macro assets remained mixed in Q2. Its rolling 3-month correlation with the S&P 500 stayed elevated, ending near the upper end of the post-2020 range. This reinforces the view that bitcoin continues to trade as a liquidity-sensitive risk asset over shorter horizons, particularly when monetary policy expectations and growth-equity narratives dominate markets.

At the same time, bitcoin did not participate in the Q2 equity rally despite that elevated correlation. This disconnect suggests that short-term correlations are not sufficient to explain performance when bitcoin-specific flows become the dominant driver. In Q2, DAT-related selling concerns and tighter policy expectations outweighed the positive signal from stronger technology and growth equities.

Bitcoin’s rolling correlation with gold also increased during the quarter as both assets declined materially. The rolling correlation with the U.S. dollar remained negative, consistent with the historical pattern that dollar strength and tighter liquidity tend to weigh on bitcoin demand yet be supportive for the dollar.
Weekly 4-Jul-10-2026-01-44-09-0977-PM
Weekly 5-Jul-10-2026-01-44-26-9272-PM
Weekly 6-Jul-10-2026-01-50-42-1469-PM

Regulation Front and Center with the CLARITY Act

U.S. crypto regulation moved to the center of the Q2 narrative, but even though the CLARITY Act cleared committee markup with provisional support, its ultimate passage is still very much up in the air. The committee vote marked a measurable change versus the prior quarter’s legislative setbacks, but the bill remains highly uncertain because ethics-related objections emerged as a clear unresolved sticking point after committee review. In addition, bank lobbying groups continue to oppose the bill because language around stablecoins paying yield is not sufficiently restrictive to limit platform workarounds, which, in their eyes, could result in deposit flight from banks to digital dollars.

Fed Transition Turns into a Liquidity Headwind

Monetary policy remained a key pressure point in Q2 as Warsh was confirmed by the Senate, sworn in as the 17th Fed Chair, and then presided over his first FOMC meeting. Rates were held firm, but the dot plot (forward rate projections) shifted hawkish. That combination pressured bitcoin because higher real-rate expectations reduce the attractiveness of long-duration, non-cash-flowing assets.

Bitcoin reached its quarterly peak around Warsh’s confirmation, making the leadership transition a timing marker for the subsequent liquidity-driven drawdown. From there, bitcoin moved from the low $80,000s toward the low $60,000s and finished below that level by quarter-end, indicating that tighter liquidity expectations outweighed equity-market strength. The investment implication is that bitcoin remains highly sensitive to marginal liquidity driven by the restrictive policy signal.

Strategy/MSTR Shifts the DAT Flow Narrative

The most important bitcoin-specific development in Q2 was the shift in the Strategy (MSTR) narrative. Earlier in the quarter, MSTR signaled it may sell some BTC, which introduced uncertainty around a buyer that had previously been viewed as a persistent source of demand. Later in the quarter, MSTR revealed that it had sold BTC, further pressuring sentiment.

The flow concern intensified when Strategy unveiled its Digital Credit Capital Framework, with approximately $1.25B of BTC sales authorized and the STRC dividend increased to 12%. This mattered because digital asset treasury companies (DATs) had been an important marginal buyer in prior quarters, and a shift from accumulation to potential supply changes the market’s clearing dynamics. The result was a quarter in which DATs collectively became a source of sell-side pressure rather than a reliable demand engine.

Commodities and Precious Metals Weaken as the Debasement Trade Reversed

Q2 weakness across commodities and precious metals reflected different drivers, with oil down 31.4% as Trump’s U.S.-Iran ceasefire reduced the geopolitical risk premium, while gold and silver fell 14.1% and 22.0% as hawkish monetary policy pressured non-yielding assets through higher real-rate expectations. The same dynamic marked a reversal of the debasement trade, because assets that had benefited from fiscal, currency, and geopolitical hedging demand at the start of the year underperformed once markets repriced toward tighter policy and lower tail-risk demand.

Bitcoin declined alongside precious metals rather than benefiting from the unwind in geopolitical stress, indicating that Q2 price action was driven more by liquidity sensitivity than by safe-haven demand. The investment implication is that bitcoin’s near-term hard-asset narrative weakened during the quarter, because lower geopolitical risk, regulatory progress, and strong equity markets were not enough to offset tighter policy expectations and softer structural demand.

Quantum Computing and the Executive Orders

Quantum computing became a more visible policy risk in Q2 after Trump signed 2 quantum-focused executive orders, raising institutional attention on a long-dated threat to public-key cryptography. The near-term technical risk to Bitcoin remains limited, but the governance risk is material because any future migration to quantum-resistant cryptography would require coordination across developers, miners, custodians, exchanges, and users. The investment implication is that quantum risk is unlikely to drive near-term bitcoin pricing, but it can remain an allocation-committee issue because protocol upgrade coordination becomes more important as policy attention increases.

DeFi Risk and the KelpDAO Hack

The KelpDAO LayerZero bridge exploit kept DeFi security risk in focus during Q2, with the event highlighting a more systemic industry issue rather than a single-protocol failure. The core risk is that DeFi capital often depends on shared middleware, bridges, cross-chain messaging, and composable smart contracts, so one exploit can affect confidence across multiple protocols and balance-sheet linkages. This is not a Bitcoin protocol failure, but it can still widen the institutional risk premium for broader digital assets because allocators often treat DeFi hacks as evidence of operational and infrastructure fragility across the asset class. The investment implication is that DeFi security remains a gating factor for institutional adoption, particularly when risk controls, insurance coverage, and audit standards lag the complexity of cross-chain infrastructure.

Bitcoin 2026 Conference Highlights Industry Activity Despite Weak Price Action

Bitcoin 2026 in Las Vegas served as a reminder that industry activity and price performance can diverge sharply over short periods. The conference occurred during a quarter when regulatory progress was made, and institutional conversations and building remained active, but bitcoin still fell. That gap suggests the market was focused less on long-term adoption narratives and more on immediate flow pressure from DATs and tighter monetary policy.

The broader implication is that industry development continues, but bitcoin’s price remains highly sensitive to marginal demand and forced or discretionary supply. Q2 showed that adoption narratives can support long-term conviction, but they do not prevent drawdowns when large holders are perceived as potential sellers.

Bitcoin’s 4-Year Cycle Comes Back into View

Bitcoin’s 2025–2026 drawdown is bringing the 4-year cycle narrative back into focus, because the timing and structure increasingly resemble the prior reset years of 2014, 2018, and 2022 even though the path has not matched those drawdowns exactly. Bitcoin is now down 54.3% from the $126K all-time high set on 10/6/25, with new cycle lows probed around the quarter-end window as bitcoin reached $57,717.55 on July 1. The drawdown has now extended to 268 days, reinforcing the view that the reset remains active rather than complete.

The historical framework matters because the 2 most recent major cycle drawdowns lasted 363 and 376 days and reached trough depths of -84.3% and -77.6%, respectively. A repeat of that duration profile with a narrower -70% drawdown, consistent with the pattern of progressively shallower cycle troughs, would imply a potential cycle low near $38K–$39K around early October. This is a scenario rather than a base-case forecast, but it illustrates why the 4-year cycle narrative is becoming more relevant as the current drawdown extends in both depth and duration.
Weekly 8-Jul-10-2026-02-47-00-1269-PM

ETF Outflows Show Weak Spot Demand, but Morgan Stanley Launch Stands Out

Q2 bitcoin ETF flows were a clear source of pressure, with total U.S. spot ETFs posting $4.9B of net outflows during the quarter. The outflows were concentrated in the largest incumbent products, with iShares Bitcoin Trust down $2.95B, Grayscale Bitcoin Trust down $1.10B, and Fidelity Wise Origin Bitcoin Fund down $903.2M, meaning the 3 largest outflow contributors accounted for $4.95B of redemptions before smaller fund-level offsets.

The notable exception was the Morgan Stanley Bitcoin Trust, which attracted $364.8M of inflows and ended Q2 with $365.0M of AUM. That launch demonstrates that distribution still matters. Morgan Stanley was able to attract inflows even amidst a crowded market and against a backdrop where most funds, especially the large incumbents, showed large outflows.
Weekly 7-Jul-10-2026-02-48-24-7745-PM

Iran Risk Premium Fades in Q2, Then Flares Up Again

The Iran conflict was a fading risk premium for most of Q2, with oil down 31.4% as markets reduced the probability of a sustained supply disruption and unwound the geopolitical premium that had supported energy prices earlier in the year. More recently, however, the Iran risk premium has flared back up after the July 8 ceasefire breakdown pushed Brent crude roughly 5%–6% higher toward $78–$79 per barrel. For bitcoin, the renewed risk is indirect because higher oil prices can raise inflation expectations, reduce the probability of Fed easing, and tighten real-rate conditions for non-cash-flowing assets. The investment implication is that renewed Iran escalation is a near-term headwind unless bitcoin begins to trade alongside gold and oil, because that would signal a shift from liquidity-sensitive risk asset toward geopolitical hedge demand.

LOOKING AHEAD

CLARITY is the Key Industry Catalyst

The CLARITY Act is the most important forward catalyst for the digital asset industry because it could establish a federal market-structure framework for exchanges, stablecoins, tokenization, custody, DeFi, and future non-bitcoin ETF approvals. The bill advanced out of the Senate Banking Committee by a 15–9 vote on May 14 and now moves to the Senate floor, making the next stage more consequential than prior committee-level progress. The timing is critical because the Senate’s current legislative window effectively runs from July 13 through August 7, followed by a recess until September 14, after which midterm politics should make contentious legislation harder to pass before November.

The main unresolved issue coming out of committee remains ethics language, with Democrats pushing provisions that would limit the ability of public officials to profit from sponsoring, endorsing, or otherwise benefiting from crypto assets while digital asset legislation is pending. That issue is likely to receive more scrutiny after President Trump’s 2025 financial disclosure that showed more than $1.4B of crypto-related income.

The second sticking point is stablecoin yield, because the GENIUS Act created a federal payment-stablecoin regime but left a gap between issuer-level yield bans and affiliate or exchange-level reward programs. GENIUS prohibits permitted stablecoin issuers from paying interest or yield directly to holders, but it does not explicitly ban affiliates or third parties from offering interest-like rewards, which banks argue could accelerate deposit flight from insured deposits into tokenized dollars. CLARITY includes potential fixes to narrow that channel, but the banking industry’s effective position remains opposition to yield in any form because stablecoins are competitive with bank deposits yet offer fewer protections for depositors.

For bitcoin, CLARITY’s direct price impact is less significant than for altcoins and crypto equities, but the investment implication remains material because a clearer U.S. market-structure regime would benefit the entire industry. Passage would likely be most supportive for crypto-linked equities, exchanges, custody platforms, tokenization infrastructure, and non-bitcoin ETF candidates, but bitcoin would still benefit if the bill improves institutional confidence and expands the investable digital asset universe. If CLARITY stalls, crypto would remain in a vulnerable state because the industry would be left without the legislative clarity it has sought since 2017, leaving agencies to rely on interpretive guidance and rulemaking that can change across administrations and falls short of durable statutory clarity.

Flows Need to Confirm Demand

Flows are the main confirmation signal for whether bitcoin demand is stabilizing after a weak first half, because ETF flows measure spot demand through traditional rails while stablecoin supply measures on-chain dollar liquidity available for deployment across the broader digital asset ecosystem. Both signals deteriorated during the drawdown, with U.S. spot bitcoin ETFs posting $4.9B of Q2 net outflows and total stablecoin market capitalization falling to roughly $311B from a late-May peak near $322B. That roughly $11B stablecoin contraction reinforces the ETF message: marginal capital has been leaving the system rather than building liquidity for immediate redeployment.

The forward setup is straightforward because bitcoin likely needs sustained ETF inflows and renewed stablecoin supply growth to climb out of the current drawdown. A rally without improving ETF flows or stablecoin supply would be less durable because it would likely reflect leverage, short covering, or positioning rather than fresh capital formation. The investment implication is that flows are the confirmation test for any recovery. Sustained ETF inflows and rising stablecoin supply would support a demand-led rebound, while continued ETF outflows or flat stablecoin balances would reinforce the view that the reset remains incomplete.

Derivatives Positioning Shows Long-Skewed Leverage Rebuilding

Derivatives positioning remains fragile because futures open interest has rebuilt while bitcoin remains near cycle lows. Open interest is not directional by itself because every futures contract has both a long and a short, but the combination of rising open interest, positive funding, and weak price action suggests long-skewed leverage is being rebuilt. That matters because leveraged longs are adding exposure before spot demand has confirmed a recovery through ETF inflows or stablecoin supply growth.

Funding rates reinforce the same point because perpetual funding has moved back into positive territory, meaning longs are paying shorts to maintain exposure. A cleaner reset would likely show lower open interest, neutral-to-negative funding, and improving spot demand. The current setup instead shows leverage rebuilding while bitcoin remains far below its October 2025 high.

glassnode-studio_fund-rates-futures-oi (1)

The investment implication is that derivatives positioning is a risk amplifier rather than a recovery confirmation signal. If ETF flows and stablecoin supply improve, long-skewed leverage could help extend a rebound. If spot demand remains weak, elevated open interest and positive funding increase the risk of another liquidation-driven move lower.

DAT and MSTR Supply Remain the Key Bitcoin-Specific Overhang

DATs remain the most important bitcoin-specific variable because the DAT complex shifted in Q2 from a source of structural demand to a potential source of supply. Strategy, the most important company in the DAT complex, recently announced a Digital Credit Capital Framework that authorizes bitcoin monetization to fund the USD reserve, preferred dividends, interest expense, and security repurchases. That changed the narrative from one-way accumulation to active balance-sheet management.

This matters because DAT buying had been an important marginal demand source in prior quarters, and even limited monetization can pressure sentiment when spot demand is already fragile. The market does not need DATs to become aggressive sellers for the overhang to matter; the risk premium widens once investors believe large holders may sell into weakness to meet capital-structure obligations.

The bearish risk is that DAT discounts widen, preferred dividend obligations remain expensive, and bitcoin monetization becomes recurring rather than episodic. However, MSTR has retained a slight premium to NAV despite putting bitcoin sales on the table and executing limited monetization, which suggests investors have not fully abandoned the DAT model.

Fed Liquidity and the Iran Risk Premium Remain Macro Pressure Points

Fed liquidity remains the main macro variable for bitcoin because higher real-rate expectations reduce the relative attractiveness of non-cash-flowing assets. The next FOMC interest rate decision is scheduled for July 29, which makes the July inflation and growth data more important for bitcoin than normal because the asset is already trading with a liquidity-sensitive profile.

The Iran conflict adds a second macro channel because the geopolitical risk premium faded through most of Q2 but then flared up again after a renewed July escalation. For bitcoin, the transmission channel is indirect because higher oil prices can lift inflation expectations, delay Fed easing, and tighten real-rate conditions. That makes renewed Iran escalation a near-term headwind.

Cycle Risk Remains Unresolved

The 4-year cycle framework remains relevant because bitcoin has fallen 54.3% at its low from the $126K all-time high set on October 6, 2025, while the drawdown continues to extend, now reaching 268 days. The 2 most recent major cycle drawdowns lasted 363 and 376 days and reached trough depths of -84.3% and -77.6%, respectively, leaving investors to determine whether the current reset is incomplete or simply shallower than prior cycles.

The current drawdown is unsatisfactory from a market-structure perspective because price has not fallen far enough to attract value buyers who believe a durable bottom is in, while the catalyst set remains too thin and the risk too big for momentum traders to reallocate capital aggressively. On-chain metrics confirm this incomplete reset phase, with several cyclical indicators (MVRV, PSIP, aSOPR, LTH SOPR) still above the trough levels that have historically marked durable bitcoin bottoms. That leaves bitcoin stuck between 2 buyer bases, with value investors waiting for either deeper capitulation or stronger bottoming evidence, and momentum investors waiting for confirmation through investment catalysts.

A narrower drawdown than prior cycles remains plausible if CLARITY advances, ETF inflows recover, DAT demand stabilizes, or a new marginal purchaser group emerges. A deeper or longer reset remains plausible if CLARITY stalls, ETF outflows persist, DAT monetization continues, and Fed policy remains restrictive.

The investment implication is that downside risk remains elevated until demand drivers improve, because the current price level does not yet offer enough valuation support to pull in value buyers or enough upside confirmation to attract momentum capital.

Start Reading
Start Reading

This report has been prepared solely for informational purposes and does not represent investment advice or provide an opinion regarding the fairness of any transaction to any and all parties nor does it constitute an offer, solicitation or a recommendation to buy or sell any particular security or instrument or to adopt any investment strategy. Charts and graphs provided herein are for illustrative purposes only. This report does not represent valuation judgments with respect to any financial instrument, issuer, security or sector that may be described or referenced herein and does not represent a formal or official view of New York Digital Investment Group or its affiliates (collectively NYDIG).It should not be assumed that NYDIG will make investment recommendations in the future that are consistent with the views expressed herein, or use any or all of the techniques or methods of analysis described herein. NYDIG may have positions (long or short) or engage in securities transactions that are not consistent with the information and views expressed in this report. The information provided herein is valid only for the purpose stated herein and as of the date hereof (or such other date as may be indicated herein) and no undertaking has been made to update the information, which may be superseded by subsequent market events or for other reasons. The information in this report may contain forward-looking statements regarding future events, targets or expectations. NYDIG neither assumes any duty to nor undertakes to update any forward-looking statements. There is no assurance that any forward-looking events or targets will be achieved, and actual outcomes may be significantly different from those shown herein. The information in this report, including statements concerning financial market trends, is based on current market conditions, which will fluctuate and may be superseded by subsequent market events or for other reasons. Information furnished by others, upon which all or portions of this report are based, are from sources believed to be reliable. However, NYDIG makes no representation as to the accuracy, adequacy or completeness of such information and has accepted the information without further verification. No warranty is given as to the accuracy, adequacy or completeness of such information. No responsibility is taken for changes in market conditions or laws or regulations and no obligation is assumed to revise this report to reflect changes, events or conditions that occur subsequent to the date hereof. Nothing contained herein constitutes investment, legal, tax or other advice nor is it to be relied on in making an investment or other decision. Legal advice can only be provided by legal counsel. NYDIG shall have no liability to any third party in respect of this report or any actions taken or decisions made as a consequence of the information set forth herein. By accessing this report, the recipient acknowledges its understanding and acceptance of the foregoing terms.

newsletter

Sign up for weekly research

Subscribe now to learn what’s driving bitcoin markets, track significant regulatory developments, and get the data that deserves your attention.

Featured Research & Insights

Q2 2026 Review: Leverage, Not Spot Demand, Is Driving Bitcoin While Value and Momentum Buyers Wait

Q2 2026 Review: Leverage, Not Spot Demand, Is Driving Bitcoin While Value and Momentum Buyers Wait

Q2 2026 Review: Leverage, Not Spot Demand, Is Driving Bitcoin While Value and Momentum Buyers Wait
Research
July 10, 2026
Read Now
Strategy: Well-Collateralized, But Flywheel is Market-Access Dependent

Strategy: Well-Collateralized, But Flywheel is Market-Access Dependent

Strategy: Well-Collateralized, But Flywheel is Market-Access Dependent
Research
July 2, 2026
Read Now
Quantum: Buy the Migration, Not the Machine

Quantum: Buy the Migration, Not the Machine

Quantum: Buy the Migration, Not the Machine
Research
June 26, 2026
Read Now
Let's Connect

Want to learn more about NYDIG?

Please complete the contact form, and we will help you find the right person to learn more.