IN TODAY'S ISSUE:
- We look at the market stresses during last week’s crypto market liquidation event, which erased $19.2B in wealth in a matter of hours.
- Though often praised for their efficiency, the expanding web of DeFi applications is increasingly revealing itself as one of the industry’s biggest vulnerabilities.
- Events like last Friday highlight the advantages of CeFi services, including NYDIG’s, which held up well during the crash.
Anddd It's Gone
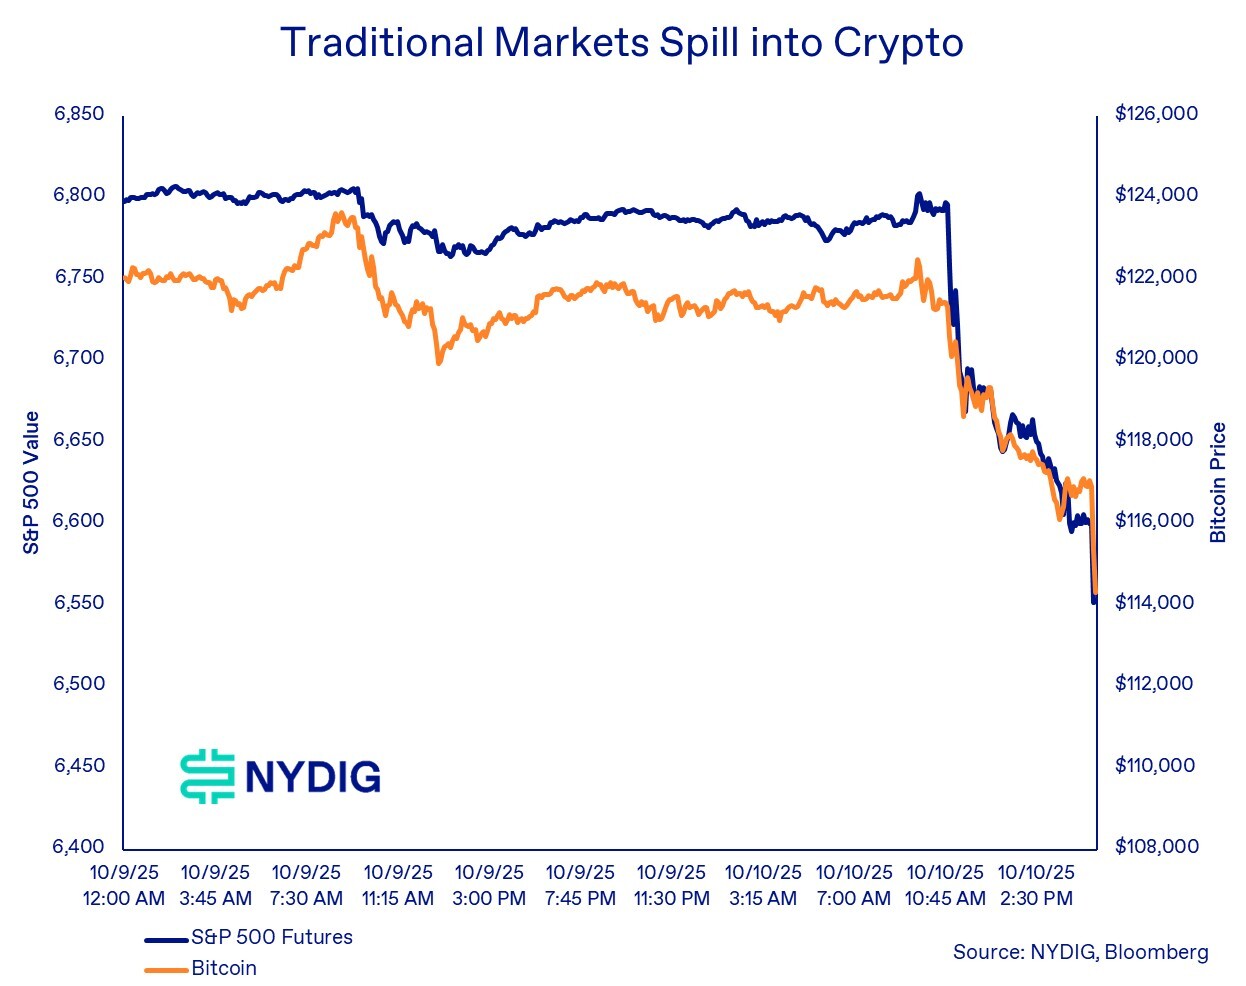
Around 11:00 a.m. Eastern on Friday, President Trump announced plans for a “massive increase” in tariffs on Chinese goods, triggering a sharp market selloff. Although specific details were not released until much later in the day, the initial shock was enough to send the S&P 500 down as much as 3.8% and the Nasdaq 100 off more than 4.7% at its lows.
Amid the broader turmoil, bitcoin and the wider crypto market plunged, with bitcoin falling 13%, stablecoins gyrating about $1.00, and several altcoins tumbling more than 40%. While the decline was severe, it wasn’t driven by crypto-specific fundamentals. It stemmed from macro and geopolitical tensions spilling over into digital assets, amplified by leveraged trading activity.
Futures Liquidations Spike, Driven by DeFi
Exacerbating the move down was the liquidations of leveraged trades, both on centralized exchanges (CEX), such as Binance, and decentralized exchanges (DEX), such as Hyperliquid. It should come as no surprise that trading, specifically leveraged trading utilizing offshore exchanges that trade perpetual swaps (funding is exchanged every 8 hours between longs and shorts), is one of the biggest features of crypto. Most of the trading activity used to happen on CEXs, with BitMEX pioneering the market with the launch of perp trading in 2016, but a new player has entered the market, Hyperliquid.
Hyperliquid is a DEX, which means it runs entirely on a blockchain (it's own blockchain), but unlike most other DEXes (Uniswap, PancakeSwap, Curve, etc.), it doesn’t run an Automated Market Maker (AMM) model that balances two tokens, such as ETH and USDC, in a pool governed by a constant product formula. Instead, it runs a fully transparent on-chain limit order book, much like a CEX (Coinbase, Binance, NYSE, etc.). But if you know anything about Hyperliquid, it has been the darling to the crypto trading market over the past 12 months, with total value locked (TVL) on the platform growing 3x (HYPE token airdrop/genesis event was November 2024) while 30d trailing spot trading volume across traditional CEXs is down by about a third (futures/perps trading volumes are down a similar percentage).
With the precipitous drop in prices, many traders were caught offside, resulting in large liquidations, the largest industry-wide deleveraging event on record. When the equity value falls below the maintenance margin requirement, if a trader doesn’t add equity capital to bring their margin up, these platforms can employ liquidation techniques, automated selling or buying engines that sell/cover losing positions in an attempt to bring the trader’s position back into compliance with margin requirements. When large numbers of positions suddenly experience losses, large anomalous price moves can happen.
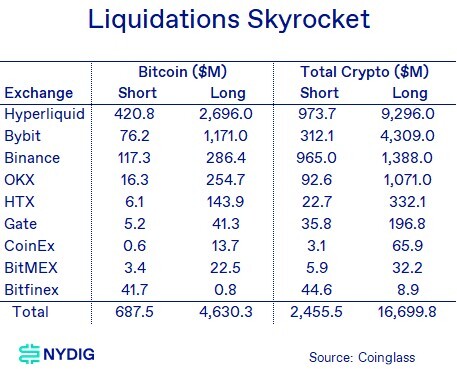
The following table shows the forced liquidations (exchange APIs label those trades as such), with $2.5B of shorts liquidated (on the rebound) and $16.7B of longs liquidated, totaling $19.2B worth of losses across all digital assets sustained by crypto traders. For bitcoin specifically, the numbers were $690M of short liquidations and $4.6B of long liquidations, evaporating $5.3B worth of bitcoin trader wealth. Hyperliquid liquidations were by far and away the largest losses sustained, with over $10B of trader net worth evaporated, resulting in Binance and Hyperliquid founders trading barbs as to which platform was showing the correct data.
Altcoins Took it on the Chin, Relatively
With bitcoin down in the teens and altcoins faring far worse, it’s no surprise that liquidations surged across the crypto market, particularly among altcoins. Among the largest cryptocurrencies, Bitcoin (BTC) saw roughly $5.3 billion in liquidations, compared with $4.4 billion for Ethereum (ETH) and $2.0 billion for Solana (SOL).
Here’s the catch — ETH and SOL are much smaller assets than BTC. Before the selloff, Bitcoin’s market cap was about 4.5× larger than Ethereum’s and 20× larger than Solana’s. Adjusting for size, that means ETH’s liquidations were roughly 3.7× greater than BTC’s on a relative basis, while SOL’s were about 7.6× higher.
In other words, investor liquidations were disproportionately severe in ETH and SOL, reflecting higher leverage, steeper price declines (BTC −13%, ETH −18%, SOL −22%), or some combination of both.

Offshore Futures Open Interest Gets Whacked, Onshore Futures Largely Unscathed
Unsurprisingly, the wave of liquidations across crypto markets hit open interest hard in bitcoin futures on offshore CEXs (so excluding Hyperliquid. In bitcoin terms, open interest fell 17.6%, representing roughly $7.9 billion in notional value wiped out during the deleveraging.
By contrast, onshore futures markets on the CME proved far more resilient. The number of outstanding contracts declined only 4.4%, or a little less than $700 million in notional terms.
The clear takeaway is that regulated, onshore traders weathered the storm far better than their offshore counterparts.
Cracks in Crypto Markets Appear
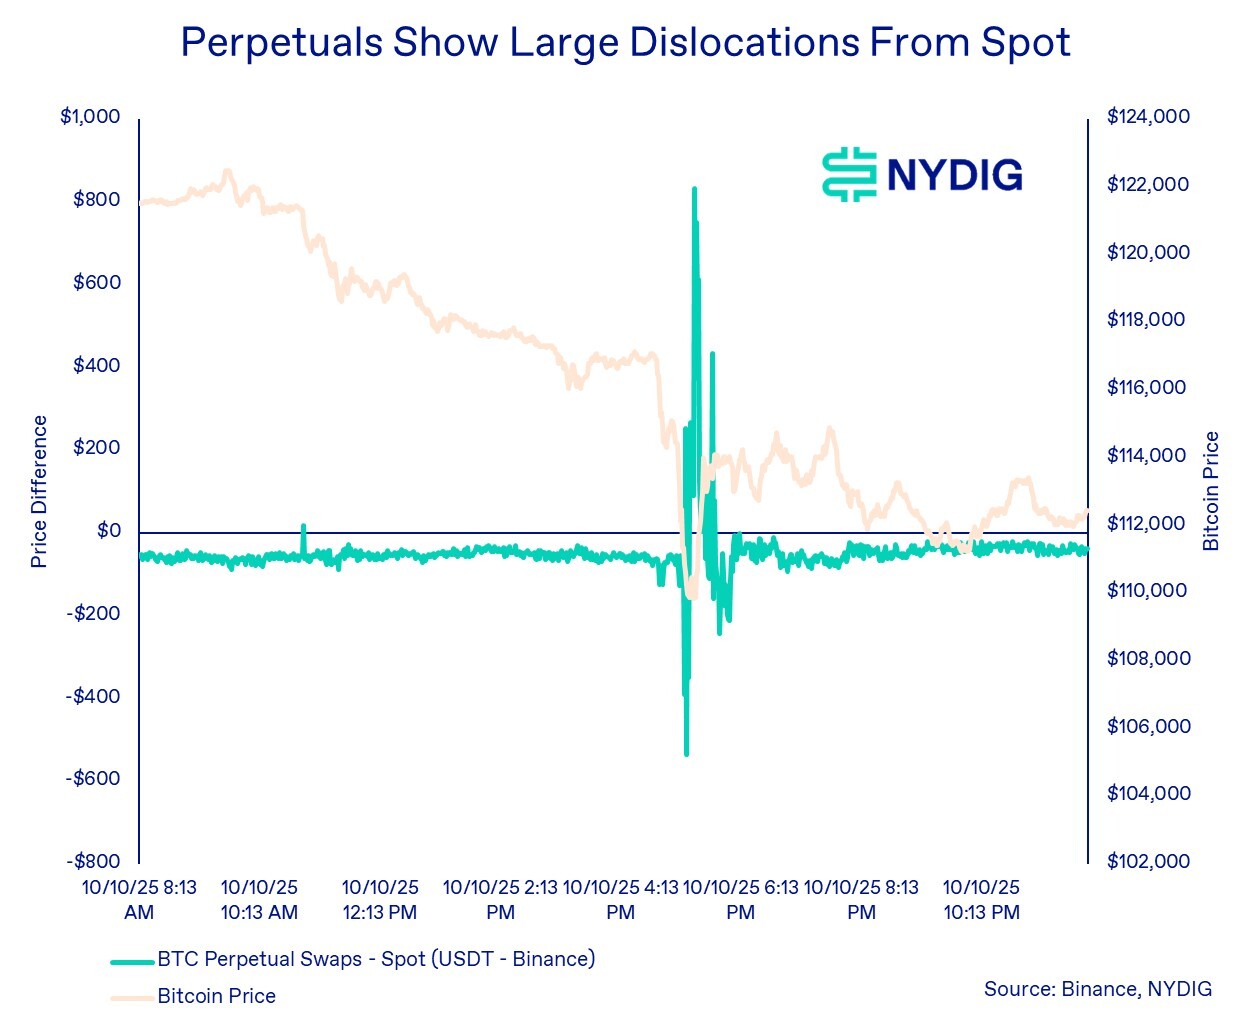
As the wave of deleveraging rippled through crypto markets, clear signs of stress emerged. Bitcoin spreads, which typically trade within tight ranges, blew out sharply. Perpetual swaps swung violently around spot prices, and U.S.-traded bitcoin began commanding a premium over offshore markets.
In the perpetual swap market specifically, the usual tight correlation with spot prices broke down completely amid liquidations on both the long and short sides. Perpetuals first traded at discounts nearing $600 per bitcoin, before flipping to premiums exceeding $800, underscoring the severity of the dislocation.
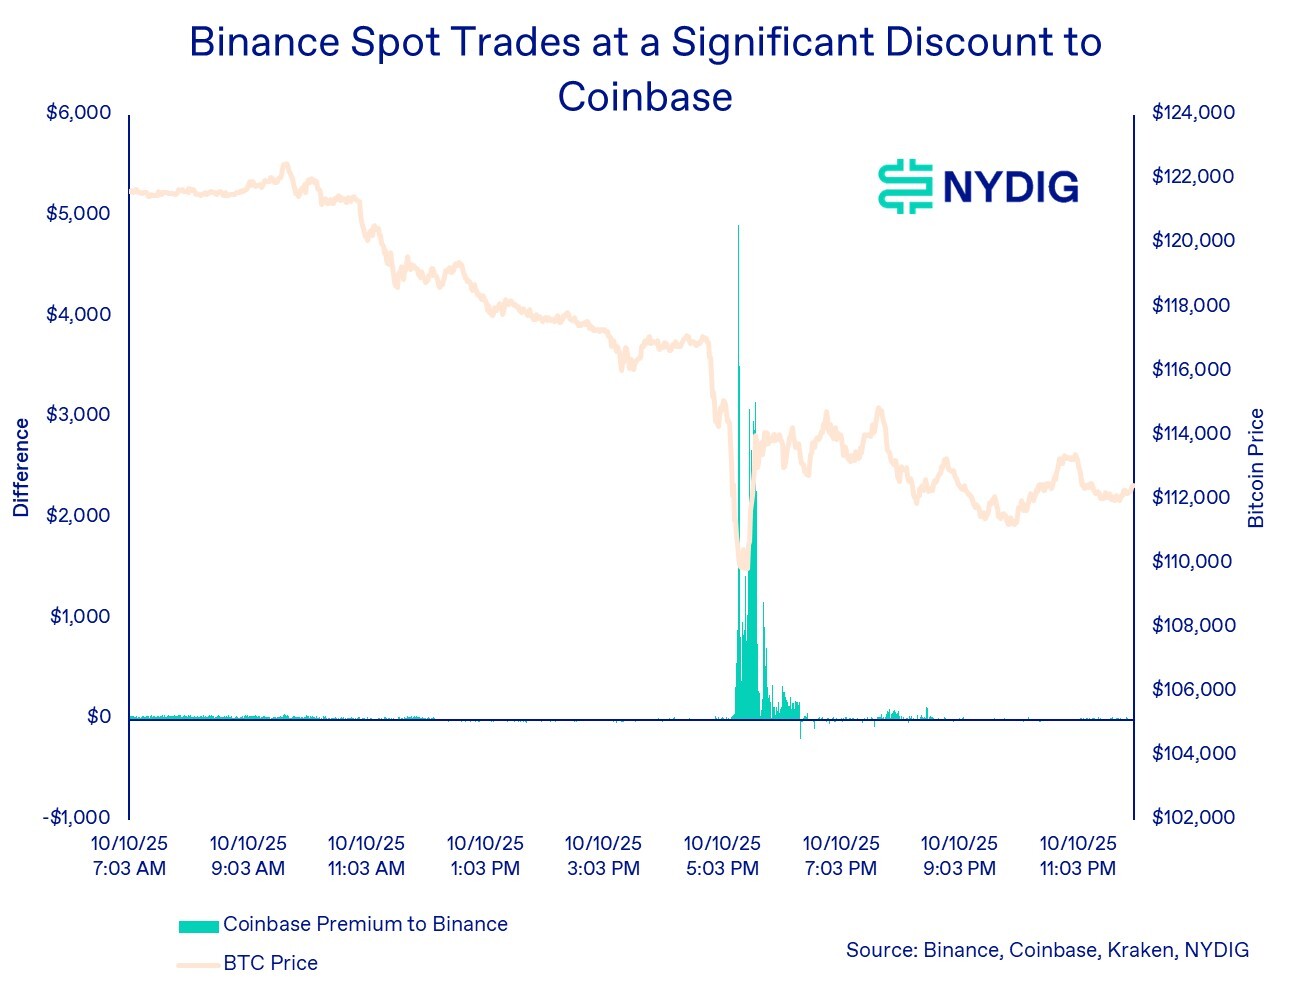
As stress built in crypto markets, counterparty risk began to surface. Bitcoin traded on Coinbase, the leading U.S. exchange, began commanding a significant premium over Binance, the world’s largest offshore exchange.
At its peak, the Coinbase premium, properly adjusted for the USD value of Tether (USDT), a step most analyses overlook, reached nearly $5,000 per bitcoin, or nearly a 5% spread. This divergence underscored growing concern over offshore market stability and funding conditions.
What’s the Price of Bitcoin?
One seemingly simple yet often overlooked question is: What is the price of bitcoin?
As we’ve shown before, the answer can vary significantly depending on where it’s trading and how it’s quoted. This distinction matters not only for trading and investment purposes, but also because bitcoin and other cryptocurrencies serve as collateral or the input into key financial activities such as lending, derivatives, and structured products.
For example, crypto-backed loans rely heavily on accurate and consistent pricing. As the table below illustrates, intraday prices for bitcoin varied by as much as 7% across major markets. That discrepancy is far from trivial. A 7% swing in reported prices can trigger margin calls or even liquidations, depending on a lender’s price feed.
Luckily, many traditional financial products, including regulated futures, options, and ETFs, have standardized around robust price indexes, such as the CME CF Bitcoin Reference Rate (BRR) for settlements and the CME CF Bitcoin Real-Time Index (BRTI) for continuous pricing. These don’t rely on one pricing source (exchange) and instead draw on data from multiple exchanges. The BRR also uses a 1-hour window and a volume-weighted median price to calculate its closing price, making it less likely to be affected by market activity like we saw last week.
Ultimately, determining “the price of bitcoin” is not a trivial exercise. It’s a foundational question that has real consequences for investors, institutions, and the stability of the broader crypto-financial system.

End the Term "Peg” for Stablecoins
Stablecoins are not pegged to $1.00. Period.
This is a long-standing market misconception, one that has even made its way into official U.S. legislation. In reality, stablecoins are market-traded instruments whose prices fluctuate around $1.00 due to trading dynamics.
Their apparent stability comes from market forces and the appearance of arbitrage, not a fixed peg. Traders buy when prices fall below $1.00 and sell when they rise above it, relying on issuers’ create-and-redeem mechanism[s] to help keep prices anchored near $1.00.
Stablecoins Break the Buck
This misunderstanding was on full display during last week’s bout of market volatility. Off-chain reserve-backed stablecoins like USD Coin (USDC) and Tether (USDT) traded at notable premiums to $1.00 as traders rushed to sell volatile assets such as bitcoin and to buy dollar proxies.
However, it wasn’t only USDC and USDT that strayed from $1.00, though their deviations were modest compared with what happened to the algorithmic stablecoin Ethena USDe. USDe, which maintains a delta-neutral position by shorting derivatives (perpetual swaps) against deposited collateral, saw its price collapse to as low as $0.65 on Binance. That drop in turn triggered forced liquidations for traders using it as collateral.
While Binance drew most of the criticism and ultimately compensated affected USDe holders, the issue was broader. Across several CEXs, USDe traded as low as $0.92 - $0.95. Binance later explained that it priced USDe using its own internal order books rather than a composite of external sources, which is precisely the problem we have been describing. Crypto prices often vary by venue, so Binance users naturally relied on Binance’s own quoted price for USDe. It is misguided to defend either USDe or Binance for this outcome as some in the industry are doing; the divergence simply illustrates how fragmented crypto markets actually function.
We will say that this price divergence seems to be simply because of a CEX order books, rather than something malfunctioning under the hood with USDe, although it’s not hard to imagine how an algorithmic stablecoin relying on derivatives markets (leverage) could run into issues. Caveat emptor.
Alphabet Soup of DeFi Belies Liquidity and Technical Risks
It wasn’t just USDe that experienced price abnormalities within DeFi land; other cryptocurrencies, mostly associated with Binance, also experienced abnormalities. DeFi has done an amazing job of papering over counterparty risk and duration mismatches, all while achieving near-perfect price parity. The reality, however, comes to roost in extreme events like this.
Consider a derivative instrument like wBETH, which recently traded at an astonishing $3,000 discount to the price of ETH (which itself fell to around $3,435). wBETH is the ticker for “Binance Wrapped Beacon Chain ETH,” which is issued to users who stake their ETH through Binance.
Ordinarily, ETH deposited to Ethereum’s Beacon Chain for staking is locked until the user requests a withdrawal. It typically takes about 24 days to enter the Beacon Chain and roughly 40 days to exit. Alternatively, users can stake through Binance (or other liquid-staking providers) and receive wBETH immediately.
Because it’s wrapped by Binance, wBETH is an ERC-20 token, making it compatible with DeFi protocols and easier to use in trading or lending applications, whereas native ETH, for technical reasons, is less flexible in such environments.
DeFi participants often treat these derivative tokens as interchangeable, trading them at narrow spreads during periods of market calm. Yet there is no economic or technical basis for this equivalence. One asset, ETH, is native to the Ethereum network, fully liquid, and endogenous to the system itself. The other, wBETH, is issued by a counterparty that offers liquid, on-demand liabilities backed by illiquid assets locked in the network for up to 40 days.
Cascading Counterparty Risks – A Demon of DeFi's Design
This is the very duration mismatch problem that traditional banks face, short-term liabilities against long-term, inaccessible assets, compounded here by additional legal and technical risks. To conflate wBETH with ETH is to ignore these critical differences. And yet DeFi continues to do so, stacking counterparty risk upon counterparty risk and transforming illiquidity into the illusion of liquidity. It’s not just illogical, it’s dangerously negligent.
It’s not just WBETH that illustrates the problem with DeFi. Many DeFi platforms today feature an overwhelming variety of assets, each with its own confusing mix of prefixes and suffixes: satUSD+, SolvBTC.BNB, AIDaUSDT, yvBal-GHO-USDf, USD (Midas mFARM), ARM-WETH-stETH, to name just a few (apologies to Pendle). One practically needs a Rosetta Stone to decode what these tokens represent, let alone to understand the risks involved. Again, caveat emptor.
Lending Markets Held Up
For all the carnage in trading markets, lending markets, both CeFi and DeFi, held up remarkably well. DeFi lending juggernaut Aave liquidated only $180M worth of collateral, which amounts to only 25bps of its $72B in TVL on the platform. Only $18M worth of collateral was liquidated on the hybrid CeFi/DeFi arrangement between Coinbase and Morpho, with $1.5B of collateral. Lender Maple reported it experienced zero losses on its CeFi book, but processed $67M of lender redemptions, with a similar amount withdrawn from its DeFi Syrup platform.
NYDIG Experienced Zero Losses
At NYDIG, we’re pleased to report that we incurred zero losses. Every margin call on our bitcoin-backed loans was promptly met with additional capital contributions. We extend our sincere thanks to our partners, clients, and counterparties for their flawless execution and professionalism during this period of volatility.
This episode highlights the key advantage of CeFi over DeFi. While DeFi and some tech-driven CeFi platforms excel at speed, efficiency, and automation, they often fail under high-stress conditions when human judgment becomes essential.
Hyperliquid traders didn’t receive a call from a human asking them to post more collateral within a grace period. There’s no relationship with a blockchain, no one to speak with, no room for negotiation. You can’t explain that a price feed is incorrect or that markets are behaving abnormally. In DeFi, your collateral is liquidated automatically and instantly, no questions asked. Game over. Insert another quarter.
Crypto Risks, Updated
We are often asked about the greatest risks facing Bitcoin and the broader crypto ecosystem. One of our longstanding concerns, regulation, has increasingly become a tailwind, while another, long-term network economics, remains an open, unanswered question. Our attention is now shifting toward a third area: technology.
Insecure code and library vulnerabilities will always exist, but their relative risk has diminished over time. What’s emerging in their place are risks tied to complex, interlocking crypto primitives. While these are primarily associated with decentralized application platforms, they’re reaching into Bitcoin through mechanisms like staking and re-staking platforms, wrapped bitcoin, and cross-chain bridges.
These are not Bitcoin itself, but layers of DeFi infrastructure encircling it. Their grasp is modest today, but the trajectory points toward deeper integration. Because these risks often remain hidden until they’ve already materialized, investors should increasingly keep them on their radar.