IN TODAY'S ISSUE:
- Strategy acknowledged for the first time since 2020 that it could sell BTC to fund dividends, signaling a broader treasury-management approach as the preferred stack grows.
- Management disclosed that MSTR issuance is only BPS-accretive above 1.22x mNAV, but this is largely due to differing dilution assumptions embedded in mNAV versus BPS calculations.
- DAT models are increasingly splitting into three categories: leveraged bitcoin vehicles (digital credit), operating companies, and active digital asset managers, making uniform valuation frameworks less useful.
- Bitcoin’s current drawdown remains materially shallower than prior cycles despite the $19B October liquidation event, with limited contagion, stable market infrastructure, and few signs of systemic stress.
Strategy Earnings Highlight the Increasing Complexity of Bitcoin Treasury Models
Strategy reported Q1 2026 results on Tuesday, including a net loss of approximately $12.5B driven primarily by bitcoin’s decline during the quarter. While the headline loss was notable, much of the market was focused on management’s commentary about the potential flexibility of its bitcoin treasury strategy. Strategy currently holds 818,334 BTC, worth approximately $65.3B at current prices, and represents roughly 3.9% of bitcoin’s eventual 21M supply.
CEO Phong Le noted on the call that the company would “probably sell some bitcoin to fund a dividend just to inoculate the market,” framing the idea as part of broader capital optimization rather than a change in long-term conviction. The comment stood out because Strategy has positioned bitcoin accumulation as its only directive since adopting the bitcoin standard in August 2020. The sale admission may reflect how Strategy’s evolving capital structure, including the rapid expansion of preferred issuance programs such as STRC, is gradually broadening the company’s treasury management framework beyond pure accumulation.
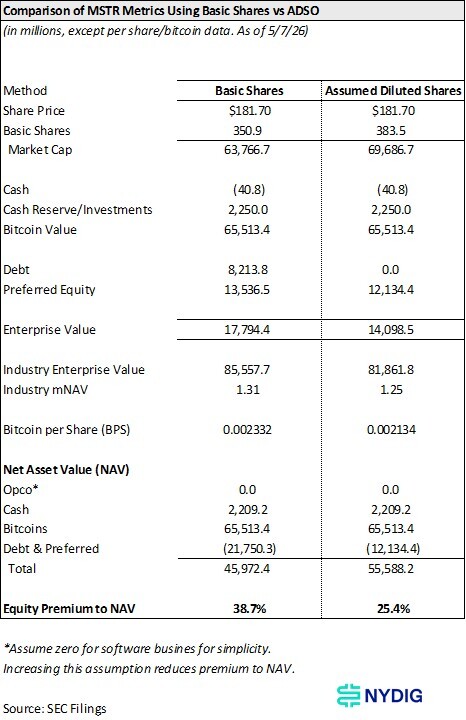
A Notable Detail on mNAV and Bitcoin-Per-Share Accretion
Another interesting disclosure from the quarter involved the relationship between mNAV and bitcoin-per-share (BPS) accretion. Management indicated that issuing MSTR equity becomes accretive to BPS only when the stock trades above approximately 1.22x mNAV, rather than at 1.0x (parity). The company attributed the higher threshold to the increasing size of its preferred equity stack.
The underlying mechanics appear largely driven by differing metric conventions. BPS is calculated using Assumed Diluted Shares Outstanding (ADSO), which incorporates potential dilution from convertible notes, convertible preferred stock, options, and RSUs. By contrast, mNAV is based on enterprise value relative to bitcoin holdings, with the market capitalization component using basic shares outstanding, with convertible debt and preferreds counted as liabilities in their notional amounts. The result is that two widely referenced metrics within the bitcoin treasury ecosystem rely on different share-count assumptions, producing outcomes that can appear unintuitive at first glance.
Growing Importance of Standardized Treasury Metrics
As bitcoin treasury companies continue to scale, consistent metric definitions may become increasingly important for both management teams and investors. In our view, there are two analytically consistent approaches: either applying basic shares throughout while treating converts as debt instruments, or applying fully diluted shares throughout while removing converts from enterprise value calculations. The key issue is less about which methodology is used and more about ensuring consistency across reported metrics and capital allocation frameworks.
The quarter also highlighted how liquidity and reserve metrics are becoming more important as treasury companies layer in preferred securities. Strategy’s public dashboard currently displays $2,250M of “USD Reserve,” while the March 31, 2026, balance sheet reported $2,209M of combined cash and restricted cash. The variance may reflect timing differences, treasury activity, or differing liquidity definitions, although no reconciliation was provided in the earnings materials. More broadly, the discussion underscores that investors increasingly need to evaluate not only bitcoin holdings but also the structure, accessibility, and prioritization of liquidity across the capital stack.
The Sector Is Increasingly Diverging into Distinct Models
One of the broader takeaways from the quarter is that digital asset treasury (“DAT”) companies are becoming less homogeneous. The sector increasingly appears to be splitting into at least three categories: leveraged bitcoin accumulation vehicles (digital credit), operating companies incorporating bitcoin into broader corporate treasury strategies, and actively managed digital asset platforms pursuing investment or yield-generation strategies.
That distinction matters because valuation frameworks may ultimately diverge alongside business models. For leveraged bitcoin accumulation vehicles, mNAV can still serve as a useful proxy for investor confidence in management’s ability to compound bitcoin-per-share growth through capital markets activity. For operating companies, however, traditional measures such as cash flow generation, earnings quality, and return on invested capital may become more relevant. Meanwhile, actively managed digital asset platforms may increasingly resemble alternative asset managers, where performance metrics and realized returns matter more than NAV premiums alone.
As a result, the DAT ecosystem increasingly resembles a hybrid of specialty finance, asset management, and operating equities rather than a single uniform category. That evolution may ultimately require more differentiated analytical frameworks than the sector has historically used.
Cycle Check-In: A Shallower Drawdown Implies More Resilient Market Structure
With bitcoin briefly breaking above $82K this week before retracing to below $80K, we revisited the current drawdown analysis compared to prior major bitcoin cycles. The graph below highlights that the current cycle, measured from the 10/6/25 peak, is tracking materially ahead of the prior four cycles on both magnitude and duration. At roughly 200 trading days into the drawdown, bitcoin is down approximately 35% from peak levels, versus drawdowns closer to 50–70% at comparable points in the 2011, 2013, 2017, and 2021 cycles. The implication is that market structure appears materially more resilient.
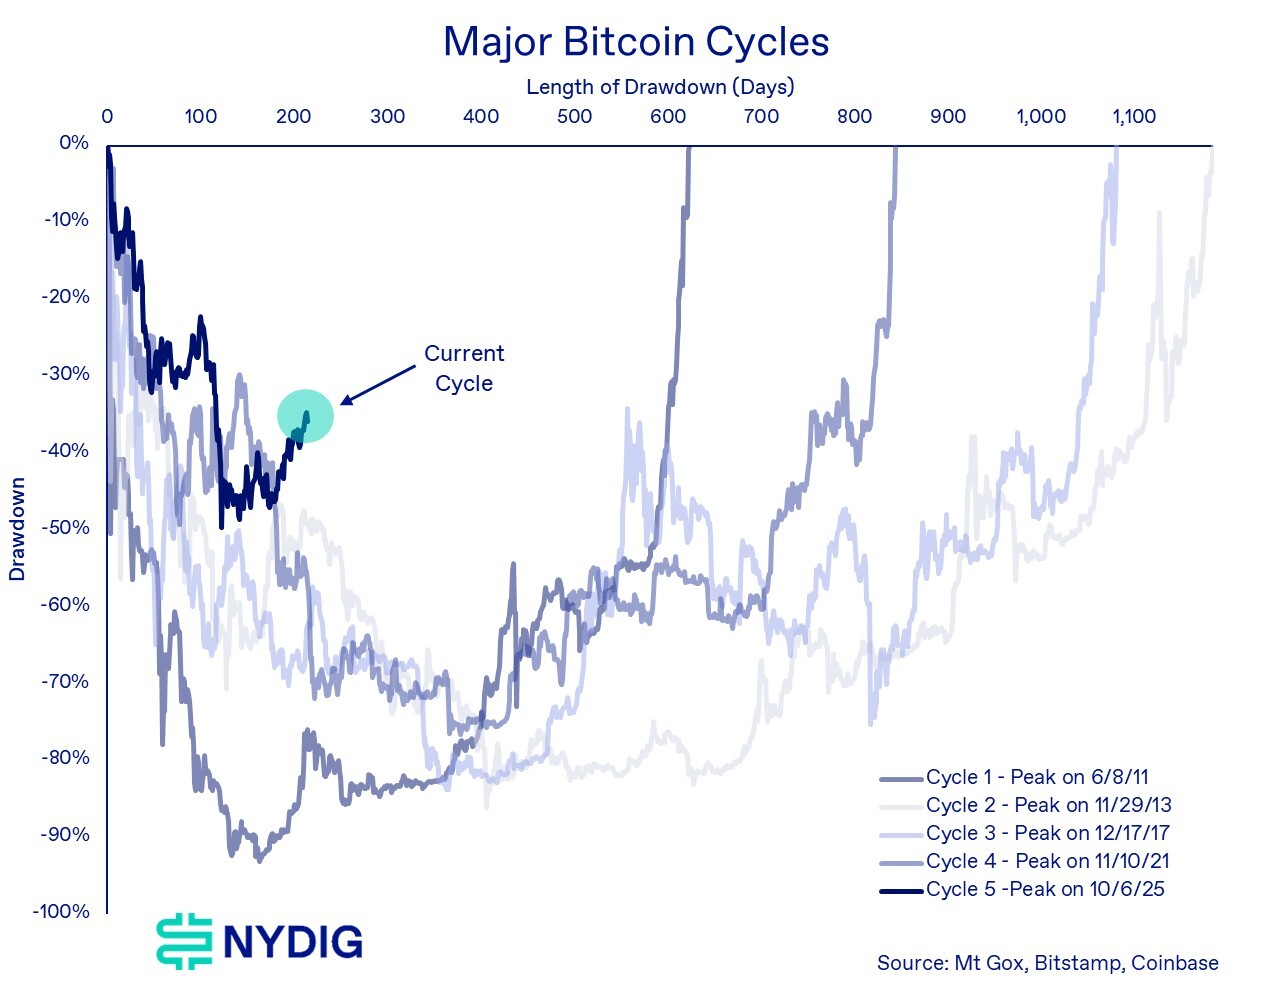
The relative shallowness of the current correction is notable given the scale of the 10/10/25 liquidation event, which purged $19B of leveraged positions out of the crypto ecosystem. Historically, deleveraging events of significant severity (none have been as large in absolute terms as the recent one) have exposed structural fragilities across exchanges, lenders, or stablecoins. In contrast, the recent selloff produced limited secondary contagion effects. The one lasting impact seems to be that trading volumes have dried up.
Importantly, the absence of systemic stress indicators differentiates this cycle from prior bitcoin drawdowns. Previous bear phases were characterized by infrastructure failures or severe market dislocations, including exchange insolvencies, forced lender unwinds, stablecoin de-pegging episodes, and persistent basis distortions between spot and perpetual futures markets. Throughout the correction from the all-time high in October, spot-to-perpetual spreads remained consistent, futures basis compressed but never inverted, and major stablecoins continued to trade near $1.00.
The broader implication is that bitcoin’s market structure may be maturing faster than prior cycles. Institutional participation, deeper market liquidity, improved collateral management, and better business practices employed by industry participants likely reduced the probability of cascading failures following the October liquidation event. If the current cycle continues to follow a shallower drawdown path, downside volatility could remain materially lower than prior post-halving cycles.
Market Update
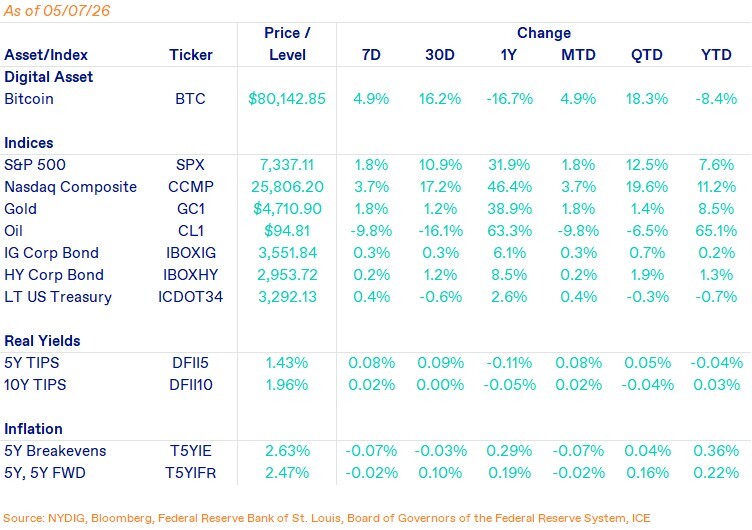
Bitcoin gained 4.9% over the past week, outperforming most traditional macro assets and extending its 30-day gains to 16.2%. During the week, bitcoin briefly broke through the $82K level before failing to hold the breakout, falling back below $80K intraday before recovering. Even with the rejection at local highs, the move marked bitcoin’s highest price level since the early February lows of $60K.
Performance across traditional assets was more mixed. The Nasdaq Composite rose 3.7% on the week and remains the strongest major benchmark over the past 30 days, supported by the AI investment thesis. The S&P 500 gained 1.8%, while gold also rose 1.8% despite higher real yields. Oil declined 9.8% over the week following de-escalation efforts with the conflict in Iran. Credit markets remained relatively stable, with both investment-grade and high-yield corporate bond indices posting modest positive returns and long-duration Treasuries recovering slightly as volatility moderated.
From a cross-asset perspective, bitcoin’s correlations with broader US equities remain elevated, reinforcing the market’s continued tendency to trade bitcoin as a macro risk asset tied to liquidity and growth expectations. At the same time, bitcoin’s correlation with software equities (IGV ETF) has continued to decline from the February peak. We highlighted previously that bitcoin’s sensitivity was more closely tied to broad liquidity conditions and real rates than to narrow software-sector beta, and recent performance has continued to support that framework.
Flows also remained constructive beneath the surface. Spot bitcoin ETFs recorded approximately $1.4B of net inflows over the past five trading sessions, providing a steady source of incremental demand despite the failure to sustain a clean breakout above $82K. Importantly, derivatives positioning still does not reflect the type of speculative excess typically associated with late-stage momentum rallies. CME basis levels remain subdued versus prior cycle highs, suggesting institutional leverage demand has not materially accelerated. Perpetual futures markets tell a similar story, with aggregate funding rates remaining near flat to slightly negative across several major venues during parts of the week. Taken together, positioning indicators suggest the recent rally has been driven more by spot accumulation and improving macro sentiment than by aggressive speculative leverage expansion.
Important News This Week
Regulation and Taxation:
Tillis-Alsobrooks Cinch Deal On Stablecoin Yield - Punchbowl News
White House Targets July 4 for Clarity Act Passage, Says Crypto Adviser Patrick Witt - CoinDesk
Investing:
Veteran Trader Peter Brandt Sees Bitcoin Hitting $250,000, but Only After a Bottom Later This Year - CoinDesk
Companies:
Bhutan Has Sold 70% Of Its Bitcoin In 18 Months. It May Have Stopped BTC Mining Too. - CoinDesk
Kraken To Buy Stablecoin Payments Firm Reap In $600 Million Deal - Bloomberg
Upcoming Events
May 12 - CPI release
May 29 - CME expiry